Figures & data
Table 1 Characteristics of Patients
Table 2 Summary of Data Sets Used in This Research
Figure 1 Framework and workflow of the present study.
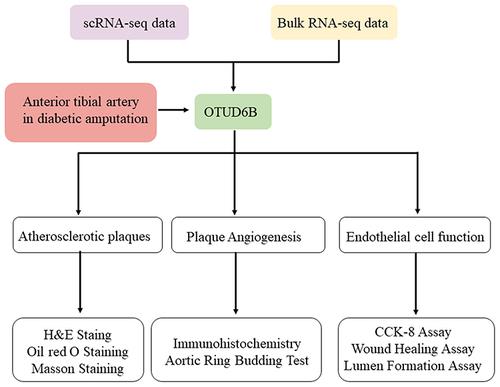
Figure 2 Expression of OUTD6B in diabetic atherosclerosis. (A) t-distributed Stochastic Neighbor Embedding (tSNE) plot of aggregate cells from diabetic atherosclerosis with colors denoting different cell clusters in the scRNA-seq data (GSE169332). (B) Violin plots of log-transformed gene expression of OTUD6B. (C) Gene expression patterns projected onto t-SNE plots of OTUD6B (scale: log-transformed gene expression). (D) The transcriptional expression of OTUD6B was evaluated in RNA-seq data (GSE173669 and GSE193781). (E) Representative images of anterior tibial artery sections from diabetic amputee patients stained with H&E, Masson, and immunofluorescence.
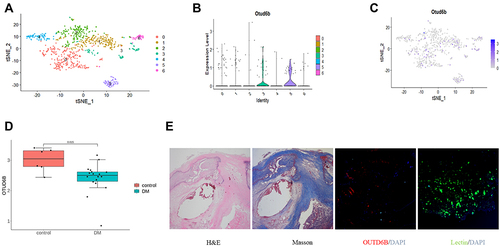
Figure 3 Diabetes decreases the expression of OUTD6B in ApoE−/− mice. (A) Representative images of aortic sections stained with H&E, Oil Red O from ApoE−/− mice. (B) Immunofluorescence staining showing the expression of OTUD6B in aortic diabetic atherosclerotic plaques. Blue-stained areas the nuclei; red-stained areas represent OTUD6B.
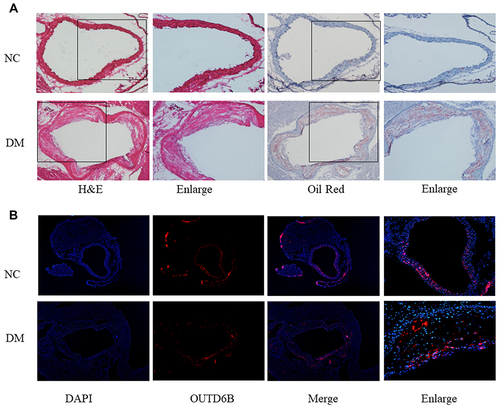
Figure 4 Effect of OUTD6B on atherosclerotic plaque formation and stability. (A) Western blot was used to detect OTUD6B expression in aorta tissue from each group. (B) The relative expression of the target protein was measured with the Image J software. (C) Representative images of aortic perfusion. (D) Representative images of H&E staining of aortic sections. (E) Quantification of plaque area. (F) Representative images of Masson staining of aortic sections. (G) Quantification of plaque collagen content. (H) Representative images of oil red O staining of aortic sections. (I) Quantification of plaque lipid content. #P<0.05 compared with the NC group. *P<0.05 compared with the DM group.
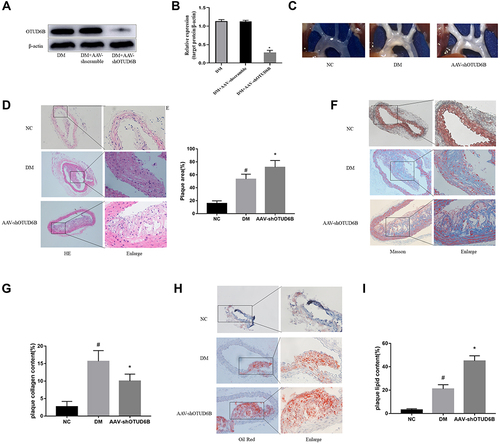
Figure 5 Effect of OUTD6B on diabetic plaque angiogenesis. (A) Representative images of aortic sections stained by Immunohistochemistry (left) and quantification of CD31 expression (right). pale brown: CD31. (B) Representative images of aortic sections stained with Immunohistochemistry (left) and quantification of CD34 expression (right). pale brown: CD34. (C) Representative images of aortic sections stained by Immunohistochemistry (left) and quantification of LYVE-1 expression (right). pale brown: LYVE-1. (D) Representative images of the aortic ring sprouting assay (left) and quantification of the number of microvessels in the aortic rings (right). #P<0.05 compared with the NC group. *P<0.05 compared with the DM group.
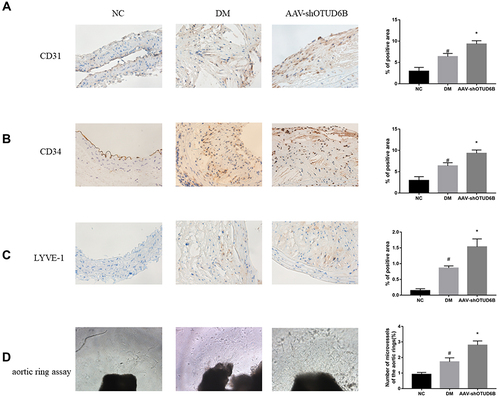
Figure 6 OUTD6B deficiency enhances proliferation, migration, and lumen formation ability in endothelial cells. (A) Cell proliferation was determined by the CCK-8 assay. (B) Wound healing assay was performed to evaluate the cell migration ability. (C) Quantification of the migration rate (D) Representative images of lumen formation ability assay. (E) Quantification of branch points. (F) Quantification of tube length. #P<0.05 compared with the NG/HL group. *P<0.05 compared with the HG/HL group.
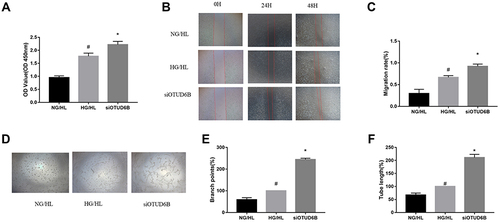
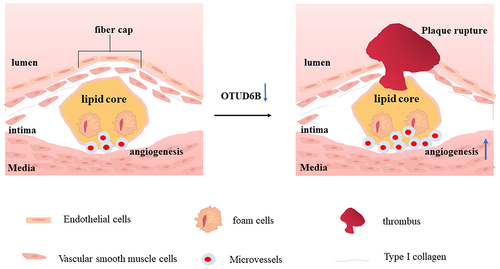
Figure 7 Summary of the roles of OTUD6B deficiency in diabetic plaque angiogenesis and plaque stability. The loss of OTUD6B may promotes angiogenesis in diabetic atherosclerosis and eventually lead to plaque rupture.