Figures & data
Figure 1 Standardization of PG-HM using LC-MS/MS (A) ESI-MRM chromatogram of Qu, its quantification in hydroethanolic extract of leaves of Psidium guajava (PG-HM). (B) Proposed fragmentation pattern for Qu using (-ve) ESI- MS2 product ion mode.
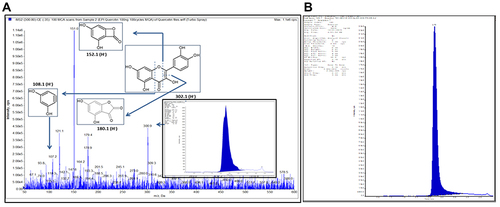
Table 1 Effect of PG-HM on Body Weight, Fructose/Water Intake, Food Intake, Fasting Blood Glucose and OGTT-AUC of Fructose Drinking Rats
Table 2 Effect of PG-HM on Visceral Weight, Lipid Profile, Liver Function Test, Activities of Pro-Inflammatory Markers and Enzymes of Glycolysis and Gluconeogenesis After 4 Weeks (Study I) and 8 Weeks (Study II) of Fructose Ingestion by Developing Rats
Figure 2 PG-HM reverted the levels of ghrelin, AKT, STAT, JNK, FOXO 1 and SREBP 1c that were skewed after (A–H) 4 weeks and (I–P) 8 weeks of unlimited fructose (15%) drinking by weaned rats. Data expressed as mean ± SD; (n=6), *p < 0.05 vs NDR, #p < 0.001 vs FDR.
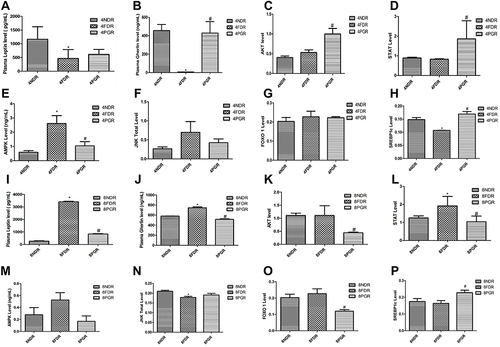
Figure 3 The FC3 arm simulates the hyperglycemic and hyperinsulinemic environment for HepG2 cells where PGH-HM and PG-EA reduced levels of (A–D) glycogen, (E–H) hexokinase, (I–L) ALDH (M–P) ketohexokinase and (Q–T) phosphofructokinase. Data expressed as mean ± SD; (n=6), *p < 0.05 vs FC1, FC2, FC3.
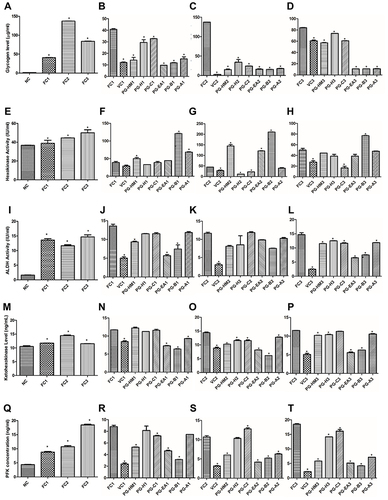
Figure 4 The FC3 arm simulates the hyperglycemic and hyperinsulinemic environment for HepG2 cells where PGH-HM and PG-EA reduced levels of (A–D) PI3k, (E–H) STAT3, (I–L) mTOR, (M–P) HIF-1ɑ, (Q–T) VEGF, and (U–X) TNF-ɑ. Data expressed as mean ± SD; (n=6), *p < 0.05 vs FC1, FC2, FC3.
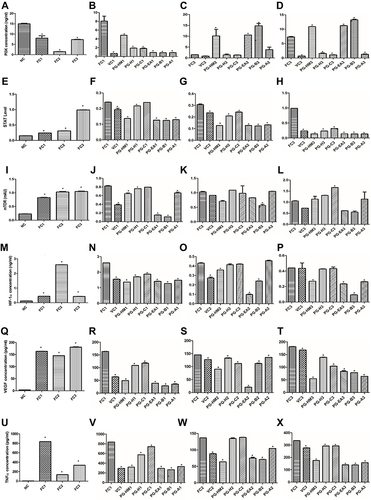
Figure 5 Comparison of PG-HM (35µg mL−1) against Pioglitazone (15 µM) and Metformin (5 mM) in facilitating the flux of fructose and glucose across murine hepatocytes. As compared to Pioglitazone and Metformin, the PG-HM performed better to lower media concentration of fructose (A-C). Pioglitazone and Metformin, performed better than PG-HM to lower glucose concentration from the media (D). Data expressed as mean ± SD; (n=6), *p < 0.05 vs FC1, FC2, FC3.
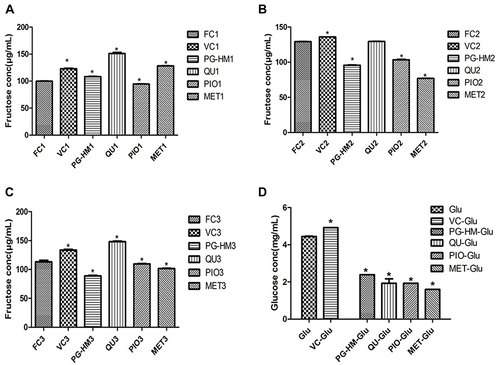
Figure 6 The effect of PG-HM on the markers of mitochondrial function in murine hepatocytes where FC3 simulates hyperglycemic and hyperinsulinemic environment. The PG-HM raised (A–D) NADHCoQ reductase (E–H), succinate dehydrogenase, (I–L) cytochrome c and (M–P) ATP synthase activities. Data expressed as mean ± SD; (n=6), *p < 0.05 vs Normal.
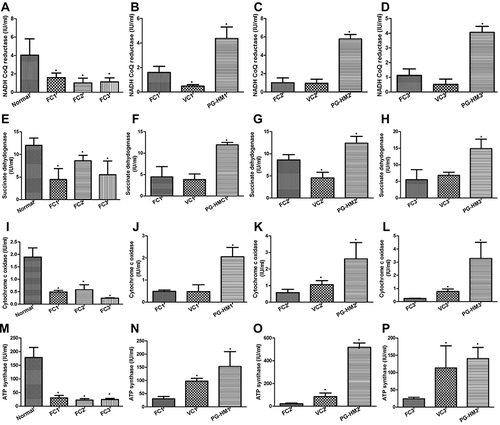
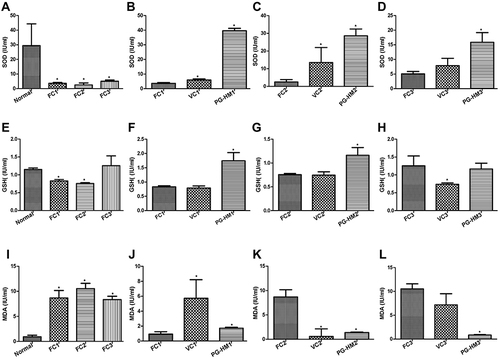
Figure 7 The effect of PG-HM on the markers of oxidative stress in murine hepatocytes where FC3 simulates hyperglycemic and hyperinsulinemic environments. The PG-HM elevated (A–D) SOD, (E–H) GSH, but (I–L) reduced MDA levels. Data expressed as mean ± SD; (n=6), *p < 0.05 vs Normal.