
Figures & data
Table 1 Clinical Characteristics of Patients (n = 742)
Figure 1 The consistency and difference between FCGM readings and REF in patients. Bland-Altman plots (A); comparison of FCGM value and REF value (B); Bias, MARD, CV, 95% limit of agreement (C); difference according to the ISO 15197:2013 standard (D). Bias: mean relative difference between FCGM and REF (FCGM-REF)/REF; MARD: |FCGM-REF|/REF; CV: standard deviation of the relative difference between FCGM and REF. Lower 95% Limit of Agreement: Bias - 1.96 × CV; Upper 95% Limit of Agreement: Bias + 1.96 × CV.
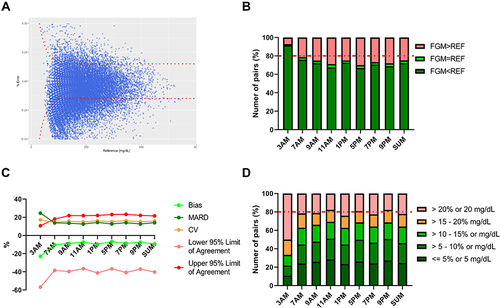
Figure 2 Comparison of the distribution of paired reading in risk zone in SEG and PEG.
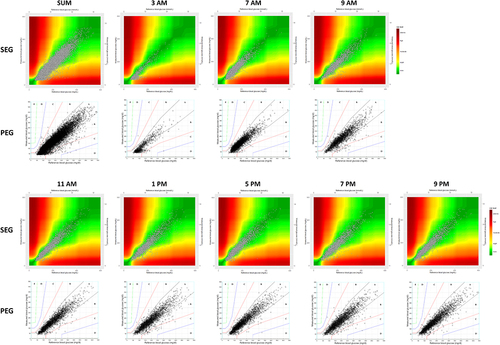
Table 2 Clinical Characteristics of Patients with SEG C/D Risk Zones
Table 3 Independent Factors Affect the Accuracy of FCGM