
Figures & data
Figure 1 PRISMA flow diagram detailing study selection, inclusion and exclusion. *Bibliographies of all review articles published in 2021 and a subset of earlier reviews selected based on titles and abstracts were screened for additional relevant articles.
Note: Adapted from Page MJ, McKenzie JE, Bossuyt PM, et al. The PRISMA 2020 statement: an updated guideline for reporting systematic reviews. BMJ. 2021;372:n71.Citation15
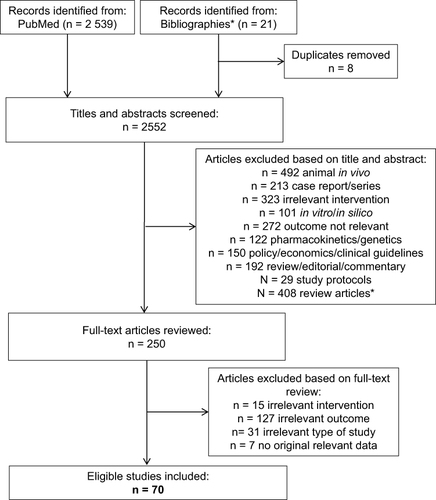
Table 1 Breakdown of Publications Identified by Treatment of Interest
Table 2 Breakdown of Studies Reporting CV Events According to Study Design
Table 3 Studies Reporting on MACE and MACE+
Table 4 Studies Reporting on Cardiovascular Death
Table 5 Studies Reporting on Myocardial Infarction
Table 6 Studies Reporting on Stroke