
Figures & data
Figure 1 Flow diagram of the subjects selection process.
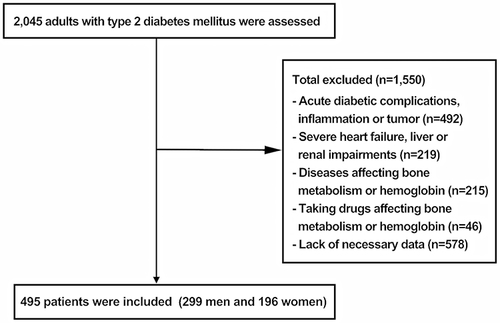
Table 1 Characteristics of the Study Population Stratified by the Prevalence of Osteoporosis
Table 2 The Prevalence of Osteoporosis and BMD Grouped by Hemoglobin Levels
Table 3 Spearman Correlation Analysis on Associations of Risk Factors with BMD and Osteoporosis
Table 4 Logistic Regression Analysis of Osteoporosis Risk Factors in Patients with T2DM
Table 5 Logistic Regression Models for the Association Between Hemoglobin Levels and Osteoporosis Stratified by Gender and Age
Table 6 The Association Between Hemoglobin at Three Levels and Osteoporosis Stratified by Gender