Figures & data
Figure 1 Schematic diagram of treatment and behavioral experiments. MG solution (60 mg/kg/day) or corresponding volume of sham control were administrated into the mice daily through ip injection. After 6 weeks treatment, the MWM basic trial was conducted. And after 9 weeks treatment, the reverse trial was conducted. Hippocampi were dissected out and homogenized using various reagents for further analysis at week 12.
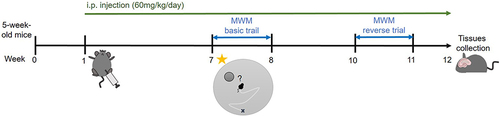
Figure 2 Long term ip injection of MG induced spatial learning ability impairment and cognition decline in mice. MG solution (60 mg/kg) or vehicle solution were administrated into the mice respectively. Spatial learning ability and cognition of mice was examined by MWM after 6 and 9 weeks. (A) Significantly longer escape latency was observed in the MG-treated mice after 6 weeks treatment. (B) Significantly longer escape latency and significant reduction of the percentage time spent in the target quadrant of the MG-treated group were observed after 9 weeks treatment. i Graph indicated the escape latency of mice in experiment day 1 to 5. ii Representative track plots and the corresponding graph indicated the time spent in the target quadrant of mice in the probe trial on experiment day 6. iii Representative track plots and the corresponding graph indicated the escape latency of mice in the probe trial with visible platform on experiment day 6, showing mice in both groups have normal vision. Data correspond to the mean and SEM of 10 mice in control group and 20 mice in MG-treated group. *p < 0.05, **p < 0.01 versus the vehicle control.
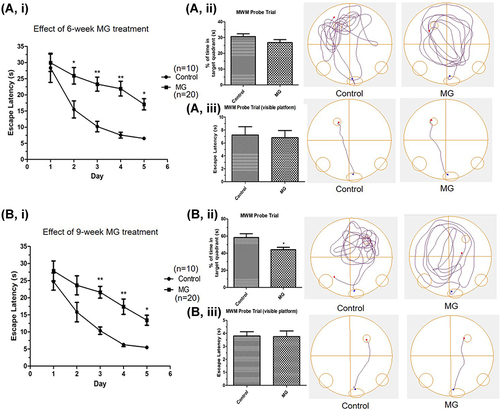
Figure 3 11 weeks ip injection of MG induced astrogliosis, ERK pathway activation, neuroinflammation response, and AD-related markers elevation in the hippocampus of C57BL/6 mice. MG solution (60 mg/kg) or vehicle solution were administrated into the mice for 11 weeks respectively. (A) Representative photomicrographs of i the immunohistochemistry staining for GFAP (indicated by red arrow) in the hippocampus of mice in each group. ii the immunofluorescence staining for GFAP (green) and beta-amyloid (red) in the hippocampus of mice in each group. One representative panel per group out of 4 mice is shown. (B) i Representative blots of GFAP and p-ERK expression in hippocampus of the two animal groups in relation to beta-actin and ERK respectively. ii Bar graph indicates quantified result in percentage. Data correspond to the mean and SEM of 6 mice in each group. *p< 0.05, **p< 0.01 versus the vehicle control. (C) Gene expressions of i astrocytic markers, ii inflammatory cytokines, and iii AD-related markers in the hippocampus of mice. Data correspond to the mean and SEM of 4 mice in each group. Beta-actin was used as mRNA internal control. *p< 0.05, **p< 0.01 versus the vehicle control.
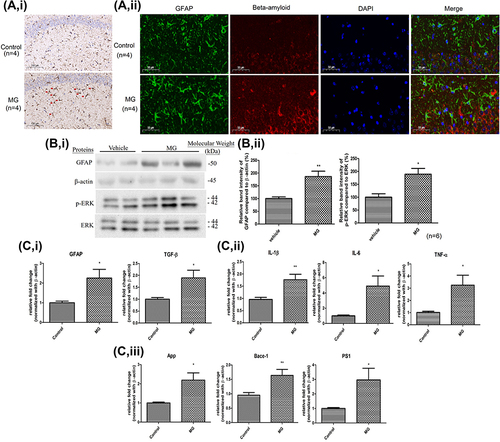
Figure 4 MG reduced cellular viability, increased astrocytic marker and pro-inflammatory cytokines in DITNC1 cells. (A) Cells were treated the indicated concentrations of MG for 24 hours. The cellular viability was found decreased in a dose dependent manner. Results are presented as means ± SEM, ***p < 0.001 versus the vehicle control. (n = 5) (B) GFAP expression of DITNC1 was examined by Western blot and was significantly increased after MG treatment. i Representative blots of GFAP expression at different concentrations of MG in relation to beta-actin. ii Bar graph indicates quantified result in percentage. Results are presented as means ± SEM, **p < 0.01, ***p < 0.001 versus the vehicle control. (n = 10) (C) The mRNA expression of DITNC1 were assessed by RT-PCR. i astrocytic markers, ii pro-inflammatory cytokines. All tested markers were found significantly up-regulated after 24 hours MG treatment. Beta-actin was used as mRNA internal control. Results are presented as means ± SEM, **p < 0.01, ***p < 0.001 versus the vehicle control. (n = 10).
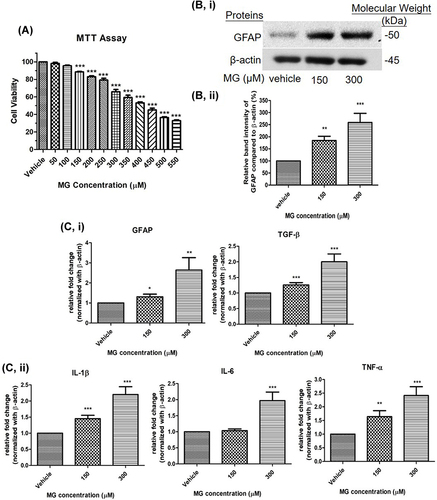
Figure 5 MG altered AD-related markers in DITNC1 cells. Cells were treated with the indicated concentrations of MG for 24 hours and the mRNA expressions were assessed by RT-PCR. APP, BACE-1, PS1 mRNA expression in DITNC1 cells were found significantly elevated. Beta-actin was used as mRNA internal control. Results are presented as means ± SEM, *p< 0.05, **p < 0.01, ***p < 0.001 versus the vehicle control. (n = 6).
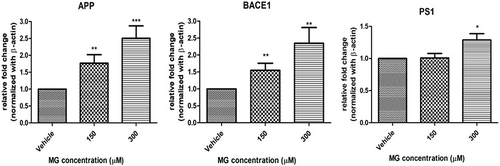
Figure 6 MG induced ERK pathway activation in DITNC1 cells. Cells were treated the indicated concentrations of MG for 24 hours. p-ERK expression of DITNC1 were then assessed by Western blot. i Representative blots of p-ERK expression at different concentrations of MG in relation to ERK. ii Bar graph indicates quantified result in percentage. Results are presented as means ± SEM, **p < 0.01, ***p < 0.001 versus the vehicle control. (n = 10).
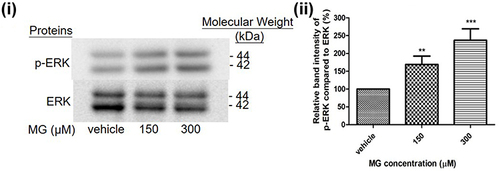
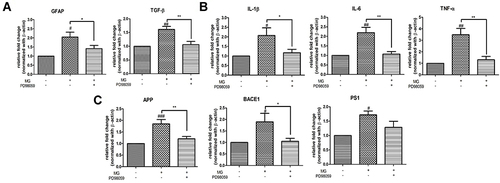
Figure 7 ERK inhibition attenuated mRNA expression of (A) astrocytic marker and TGF-β (B) inflammatory cytokines (C) AD-related markers in DITNC1 cells. Cells were incubated with 20μM of PD98059 for 2 hours prior to 300μM MG treatment. Cells were then harvested after 24 hours MG treatment. mRNA expression of all tested were markedly increased after MG treatment alone while trend of down-regulation of the markers were observed after PD98059 treatment. Results are presented as means ± SEM, *p< 0.05, **p< 0.01 versus MG. #p< 0.05, ##p< 0.01, ###p < 0.001 versus the vehicle control. (n = 6).