
Figures & data
Figure 1 Illustrates the screening procedure of the research object population, which shows how the study object population entered the study.
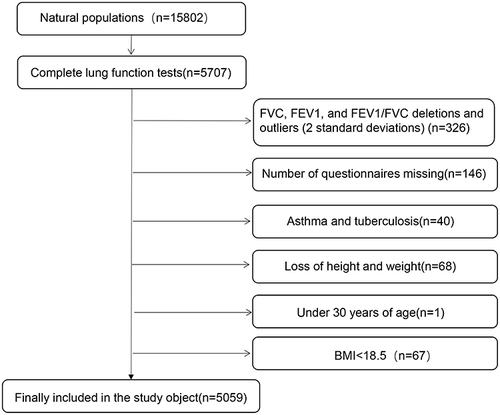
Table 1 Population Demographic Distribution
Table 2 Logistic Regression Analysis of Influencing Factors of Lung Function Decline
Table 3 Correlation Analysis of Obesity Type and Lung Function Index
Table 4 Correlation Analysis of Obesity Indicators and Lung Function Indicators