Figures & data
Table 1 Characteristics of Research Subjects
Figure 1 Plasma concentrations of ANGPTL3 in control and disease groups.
Notes: The concentration of ANGPTL3 in plasma increased from healthy control to diabetes groups. The group control was significantly higher than group disease. p-values in Mann–Whitney test were showed in figure.
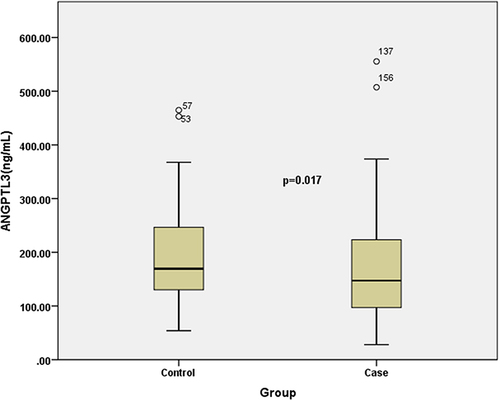
Table 2 Correlation Between ANGPTL-3 Concentration and Some Clinical and Subclinical Characteristics in the Patient Group
Figure 2 The relationship between ANGPTL3 and HDL-cholesterol in the patient group.
Notes: r, p-value with Pearson correlation between plasma ANGPTL3 and HDL-C were showed on the figure.
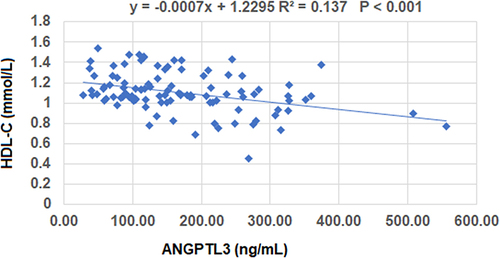
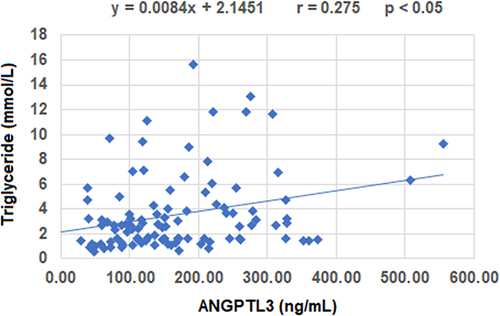
Figure 3 The relationship between ANGPTL3 and Triglyceride in the patient group.
Notes: r, p-value with Pearson correlation between plasma ANGPTL3 and Triglyceride were showed on the figure.