
Figures & data
Table 1 Comparison Between Frail and the Non-Frail Adults
Table 2 Logistic Regression Analysis of Factors Associated with Frailty
Table 3 Correlation Between Frailty and eVFA, BMI and WHR
Figure 1 Correlation between frailty and eVFA, BMI and WHR. Spearman correlation coefficients were calculated between frailty phenotype score and (A) eVFA, (B) BMI, (C) WHR in women (middle-aged and older adults), (D) eVFA in older adults (men and women).
Abbreviations: BMI, body mass index; WHR, waist-to-hip ratio; eVFA, estimated visceral fat area.
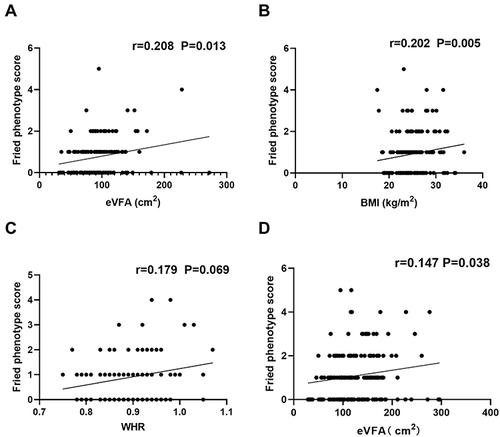
Table 4 Correlation Between eVFA/TF and Other Variables