Figures & data
Figure 1 Comparison of baseline characteristics of normal, overweight and obese healthy populations. (A) Age. (B) Fasting glucose. (C) HbA1c. (D) Systolic blood pressure (SBP). (E) Diastolic blood pressure (DBP). ***P<0.001. *P<0.05. ns P>0.05.
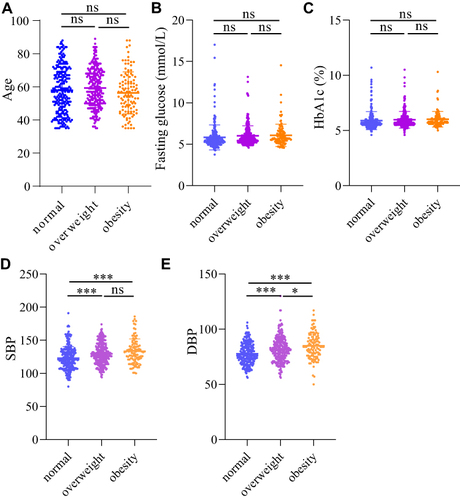
Figure 2 Comparison of blood lipid levels in normal, overweight and obese healthy populations. (A) Low-density lipoprotein-cholesterol (LDL-C). (B) Total cholesterol (TC). (C) High-density lipoprotein-cholesterol (HDL-C). (D) Triglycerides (TG). ***P<0.001. ns P>0.05.
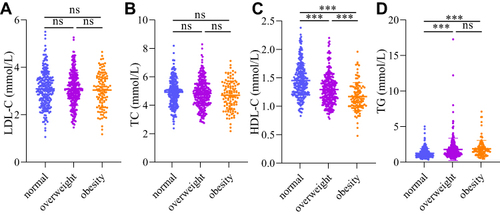
Figure 3 Comparison of basilar artery function. (A) Basilar artery (BA) pulsatility index. (B) BA systolic blood flow. (C) BA diastolic blood flow. (D) Mean BA blood flow. ***P<0.001. *P<0.05. ns P>0.05.
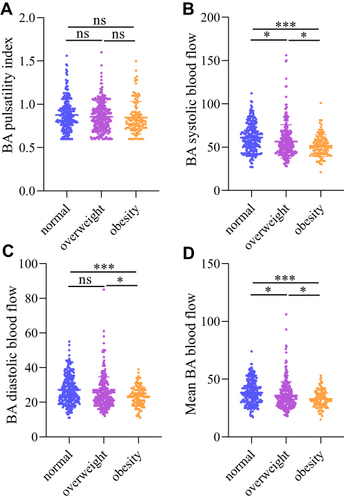
Figure 4 Comparison of internal carotid artery function. (A and B) Left and right internal carotid artery (ICA) pulsatility index. (C and D) Left and right ICA systolic blood flow velocities. (E and F) Left and right ICA diastolic blood flow velocities. (G and H) Left and right ICA mean blood flow velocities. ***P<0.001. **P<0.01. *P<0.05. ns P>0.05.
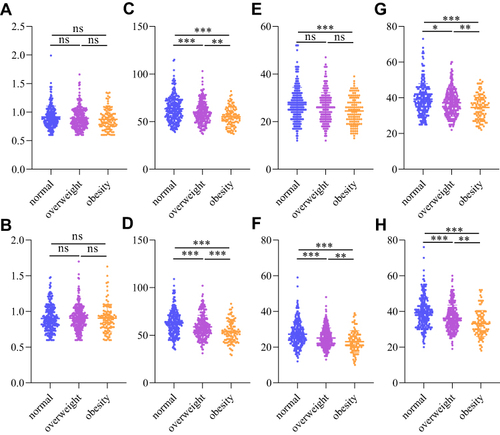
Figure 5 Comparison of vertebral artery function. (A and B) Left and right vertebral artery (VA) pulsatility index. (C and D) Left and right VA systolic blood flow velocities. (E and F) Left and right VA diastolic blood flow velocities. (G and H) Left and right VA mean blood flow velocities. ***P<0.001. **P<0.01. *P<0.05. ns P>0.05.
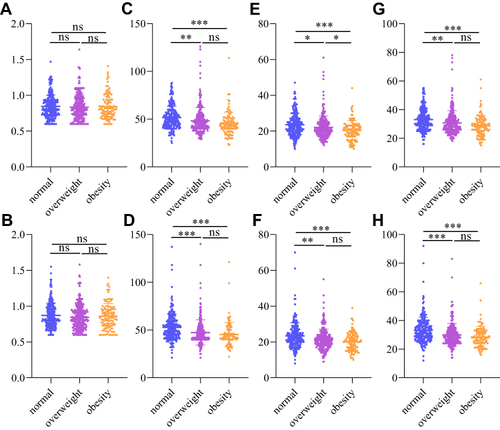
Table 1 Correlation Between BMI and Cervical Vascular Function Parameters
Table 2 Correlation Between BMI and Cervical Vascular Function After Adjustment for Confounding Factors
Figure 6 Correlations between BMI and cervical vascular function parameters. (A) BA systolic blood flow. (B) BA diastolic blood flow. (C) Mean BA blood flow. (D) Right ICA systolic flow velocity in proximal cranial segment. (E) Right ICA diastolic flow velocity in proximal cranial segment. (F) Mean right ICA flow velocity in proximal cranial segment. (G) Right VA systolic flow velocity in intracranial segment. (H) Right VA diastolic flow velocity in intracranial segment. (I) Mean right VA flow velocity in intracranial segment. (J) Left ICA systolic flow velocity in proximal cranial segment. (K) Left ICA diastolic flow velocity in proximal cranial segment. (L) Mean left ICA flow velocity in proximal cranial segment. (M) Left VA systolic flow velocity in intracranial segment. (N) Left VA diastolic flow velocity in intracranial segment. (O) Mean left VA flow velocity in intracranial segment. The horizontal coordinates represent BMI, and the vertical coordinates are parameters of cervical vascular function.
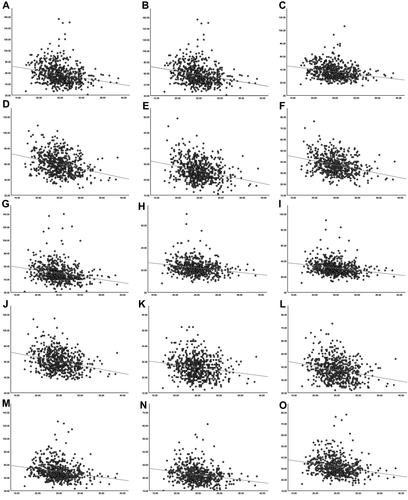
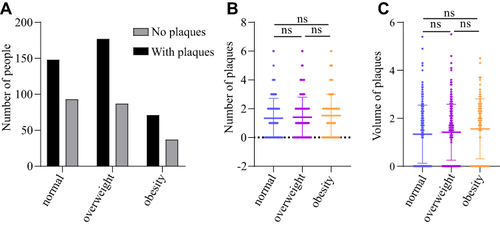
Table 3 Obesity and Overweight Affect Carotid Plaque
Figure 7 Comparison of carotid plaques. (A) Histogram of the number of carotid plaques with or without plaque between normal, overweight and obese populations. (B) Comparison of carotid plaque counts between normal, overweight and obese populations. (C) Comparison of maximum carotid plaque volume between normal, overweight and obese populations. ns P>0.05.