Figures & data
Table 1 Baseline Characteristics of Participants According to Quartiles of TyG Index (N = 2056)
Figure 1 Cumulative incidence of MAFLD according to quartiles of TyG at baseline (average follow-up years=2.5±0.5). (A) Incidence of MAFLD in total population. (B) Incidence of MAFLD in male. (C) Incidence of MAFLD in female. The variables were tested by χ2-test for linear trend and multiple comparisons. Bonferroni correction was applied in all multiple comparisons (PBonferroni =0.05/6=0.008).
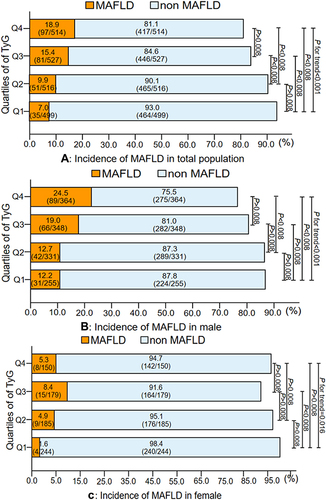
Table 2 Univariate Analysis of Potential Predictive Factors for MAFLD
Figure 2 Kaplan-Meier analysis of MAFLD risk according to TyG index quartiles (Log rank test P < 0.001). TyG index Q1: <7.93, Q2: ≥7.93 to <8.23, Q3: ≥8.23 to <8.58, Q4: ≥8.58.
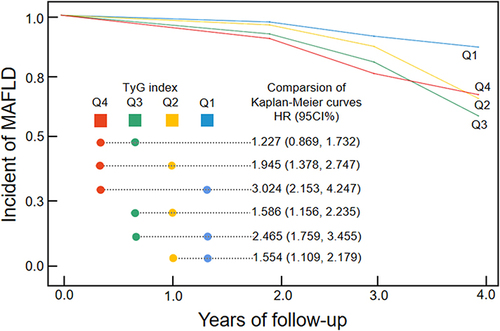
Table 3 Association of TyG Index with MAFLD Risk in Cox Proportional Hazard Models
Figure 3 A nonlinear relationship of TyG index with risk of MAFLD. (A) male and female (total population). (B) male. (C) female. Data were fitted using a Cox regression model of the restricted cubic spline with 3 knots at 10th, 50th and 90th percentiles of baseline TyG index. The reference point was the 50th percentile of the TyG index (8.23). The solid red line represented point estimation on the association of TyG index with MAFLD, and the shaded portion represented 95% CI estimation. In crude model, adjusted for none. In model 1, adjusted for sex, age and BMI at baseline. In model 2, adjusted for sex, age, BMI, hypertension, GGT, ALT, AST, LDL-C, low HDL-C, TC and SUA at baseline. All covariates were brought into the model in the form of categorical variables.
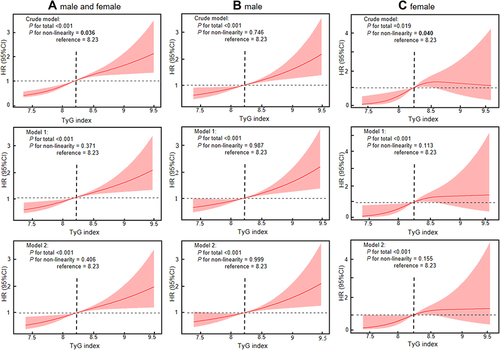
Table 4 Subgroup Analysis of Association Between TyG Index and MAFLD Risk
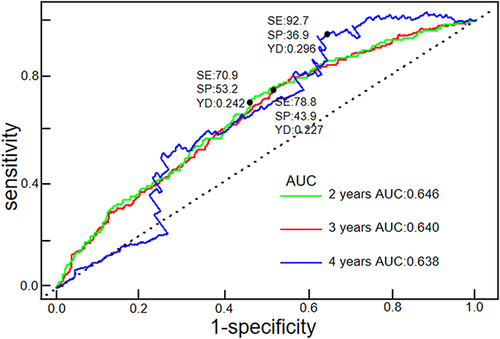
Figure 4 Time-dependent ROC of TyG index in predicting 2-, 3-, and 4-year risk of incident MAFLD.