Figures & data
Figure 1 (A) Workflow of the study; (B) Flowchart of patient selection.
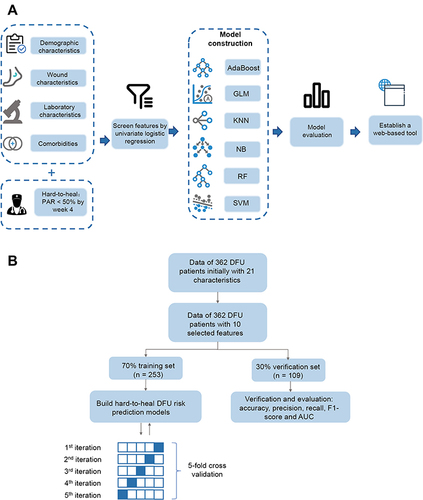
Table 1 Differences Between Demographic and Clinical Characteristics of Healed and Hard-to-Heal Groups
Table 2 Prediction Factors for Hard-to-Heal in DFUs
Figure 2 Confusion matrix of the risk prediction models with machine learning algorithms. (A) AdaBoost: adaptive boosting; (B) GLM: general linear regression; (C) KNN: k-nearest neighbor; (D) NB: naïve Bayes; (E) RF: random forest; (F) SVM: support vector machine.
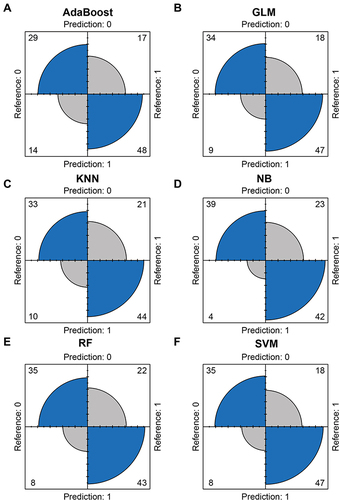
Table 3 The Comparisons of Machine Learning Algorithms
Figure 3 ROC curves for predicting hard-to-heal in DFU patients with machine learning algorithms.
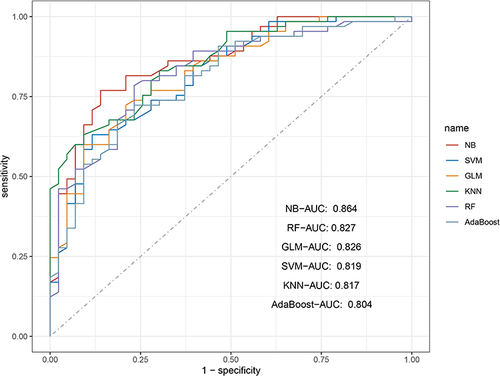
Figure 4 The values of evaluation metrics of six machine learning algorithms.
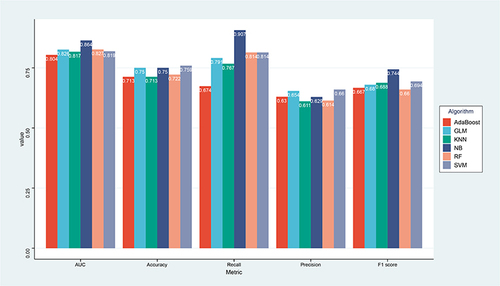
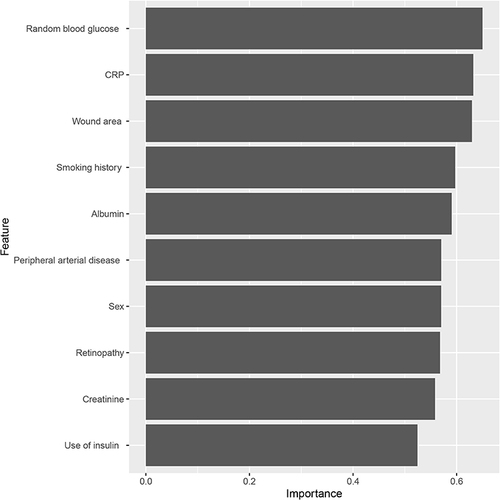
Figure 5 Feature importance ranking of the included feature of the naïve Bayesian model.