Figures & data
Table 1 Characteristics and Clinical Features of Study Population
Figure 1 DECs in ET2DN, T2DM and control groups. (A) The Box Plot displayed the normalized intensity distribution of all data. (B) Hierarchical clustering for DECs between ET2DN, T2DM, and control. High relative expression in red, low relative expression in green. Scatter plots were performed to analyze DECs in ET2DN vs T2DM group (C), T2DM vs control group (D) and ET2DN vs control group (E). CircRNAs above the top green line and below the bottom green line indicated more than two-fold change in circRNAs between the two groups.
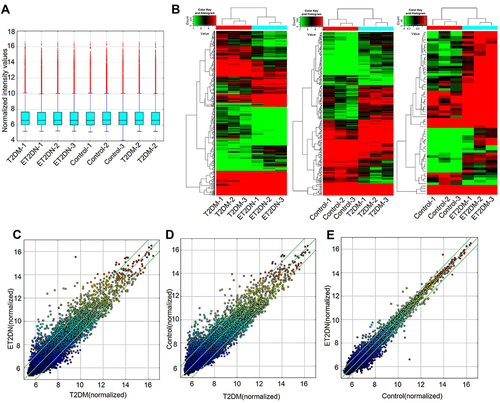
Figure 2 Volcano Plots in ET2DN, T2DM and control groups indicated the DECs between ET2DN vs T2DM group (A), T2DM vs control group (B) and ET2DN vs control group(C). Fold change values are marked by the vertical lines. A green vertical line corresponds to a 1-fold change, while a horizontal green line marks a p-value <0.05, red point represents DECs.
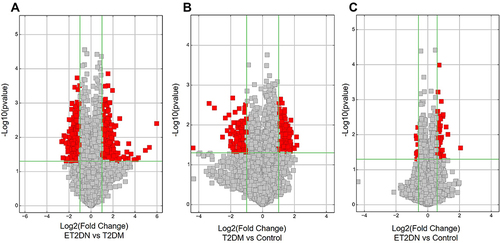
Table 2 Upregulated of circRNAs in ET2DN Vs T2DM Group
Table 3 Downregulated of circRNAs in ET2DN Vs T2DM Group
Figure 3 GO and pathway analysis of DECs for their host genes in ET2DN vs T2DM group. GO analysis of upregulated (A) and downregulated (B) DECs in ET2DN vs T2DM group. Pathway analysis of upregulated (C) and downregulated (D) DECs in ET2DN vs T2DM group. (E) The common circRNAs were analyzed in ET2DN vs T2DM group and ET2DN vs control group.
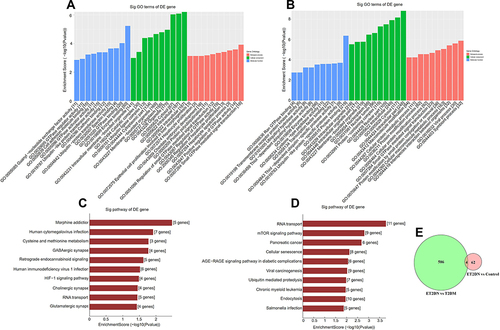
Figure 4 Verification of DECs by qRT-PCR. The expression of hsa_circ_0001831(A) and hsa_circ_0000867(B) in three groups; The expression of hsa_circ_0061260(C) and hsa_circ_0044235(D) in ET2DN vs T2DM group; The expression of hsa_circ_0063503(E) and hsa_circ_0000658 (F) in ET2DN vs control group; The expression of hsa_circ_0044235 (G) in T2DM vs control group. n=20, *p<0.05, **p<0.01, ***p<0.001.
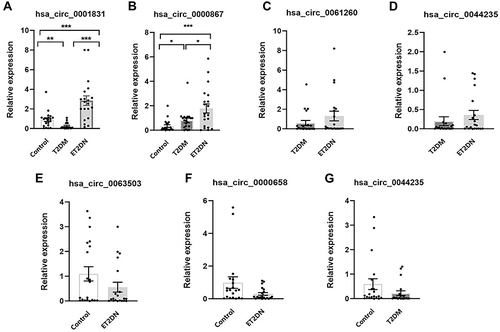
Figure 5 Prediction of hsa_circ_0001831 and hsa_circ_0000867–microRNA–mRNA interaction network. The possible microRNAs of hsa_circ_0001831 (A) and hsa_circ_0000867 (B) were predicted by Arraystar’s home-made software based on TargetScan and miRanda, next, DIANA TOOLS software was used to predict target mRNAs of microRNA, Cytoscape 2.8.2 was used to display circRNA–microRNA–mRNA interaction network.
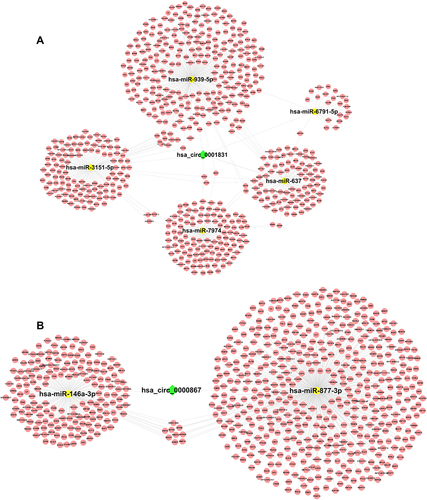
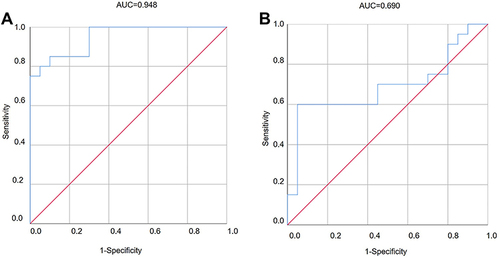
Figure 6 ROC curve analysis of diagnostic value in hsa_circ_0001831 (A) and hsa_circ_0000867 (B) in ET2DN patients.