Figures & data
Table 1 Comparison of Indicators Between the Male and Postmenopausal Female Groups
Figure 1 Flow chart.
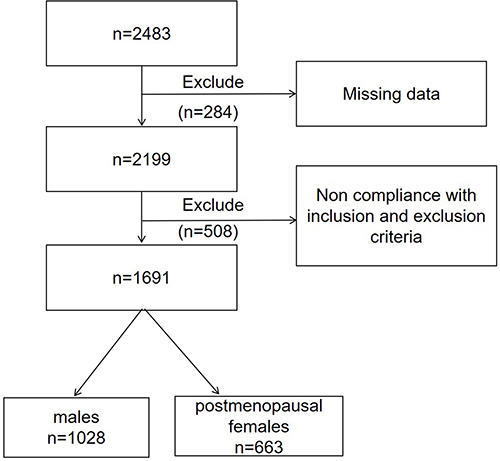
Table 2 Comparison of Indicators Between the Low SUA/Cr and High SUA/Cr Groups
Figure 2 Spearman's correlation coefficient matrix illustrating the association between SUA/Cr and baseline patient characteristics in T2DM patients (A) all patients; (B) male patients; (C) postmenopausal female patients.
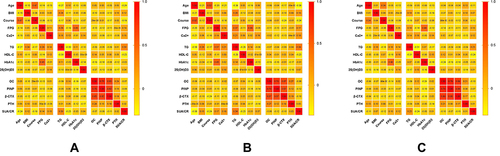
Figure 3 The correlation between SUA/Cr and BTMs levels in T2DM participants (A) all patients; (B) male patients; (C) postmenopausal female patients.
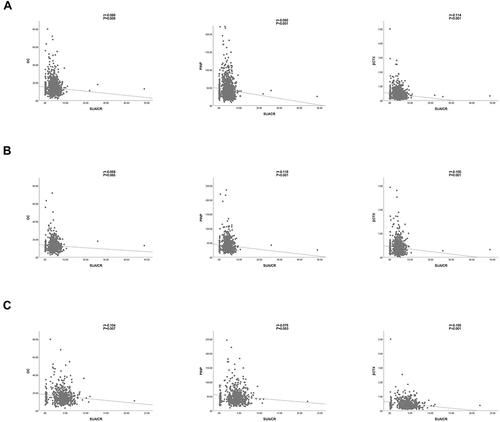
Table 3 Correlation of SUA/Cr with BTMs in T2DM Patients
Table 4 Subgroup Correlation Analysis of SUA/Cr and BTMs
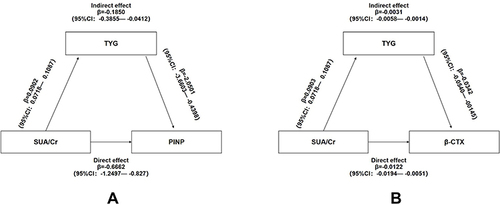
Figure 4 Mediation of TYG on the association between SUA/Cr and BTMs (A) PINP; (B) β-CTX.