Figures & data
Table 1 Clinical Characteristics of Normal and GDM Groups
Figure 1 MiR-17-5p, TXNIP and NLRP3 expression in placental tissues in GDM group (n=16) and Normal group (n=16). (A) Quantitative analysis of miR-17-5p expression in placental tissues by qRT-PCR. (B) Representative images of immunofluorescence double staining of TXNIP (red) or NLRP3 (red) and CK7 (green) in placental tissues of GDM and Normal groups. (C and D) The mRNA expression of TXNIP (C) and NLRP3 (D) were detected in normal tissues and GDM tissues by qRT-PCR. (E–G) The protein expression of TXNIP (G) and NLRP3 (H) was detected in normal tissues and GDM tissues by Western blot. **P<0.01, ***P<0.001.
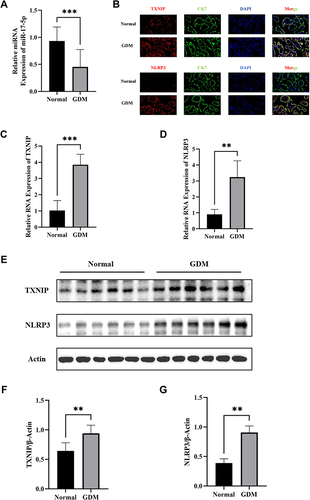
Figure 2 MiR-17-5p regulates TXNIP expression in HTR8/SVneo cells. (A and B) The mRNA expression of TXNIP was detected by qRT-PCR. (C–F) Representative images and quantitative analysis of TXNIP protein expression. (G) The binding sites between miR-17-5p and TXNIP 3’UTR predicted by Targetscan. TXNIP-WT or TXNIP-MUT was co-transfected with miR-17-5p mimic or miR-17-5p mimic NC into HTR8/SVneo cells. Luciferase activity was measured using luciferase reporter assay. *P<0.05, **P<0.01.
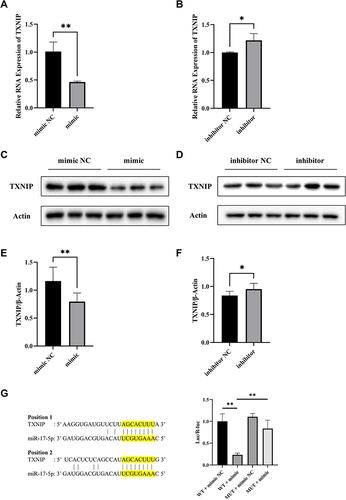
Figure 3 MiR-17-5p regulates NLRP3 expression and glucose uptake in HTR8/SVneo cells. (A and B) The expression of NLRP3 mRNA of transfected HTR8/SVneo cells detected by qRT-PCR. (C–F) Representative images and quantitative analysis of NLRP3 protein expression. (G) Relative quantitative analyses of glucose consumption. *P<0.05, **P<0.01, ***P<0.001.
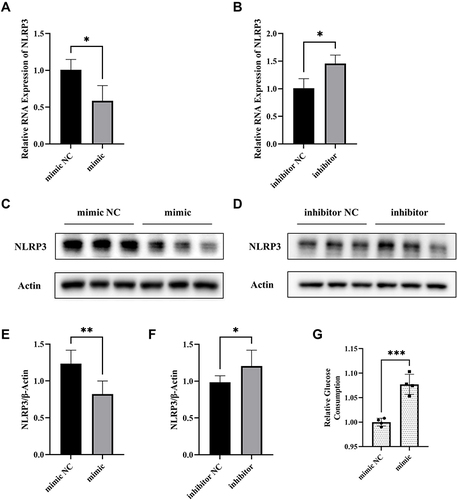
Figure 4 Effects of TXNIP on regulation of NLRP3 expression and cellular glucose uptake in HTR8/SVneo cells. (A and B) The mRNA expression of TXNIP and NLRP3 in HTR8/SVneo cells transfected with TXNIP Vector or Blank. (C–E) Representative images and quantitative analysis of TXNIP and NLRP3 protein expression detected by Western blot. (F) Relative quantitative analyses of glucose consumption. *P<0.05, **P<0.01, ***P<0.001, ****P<0.0001.
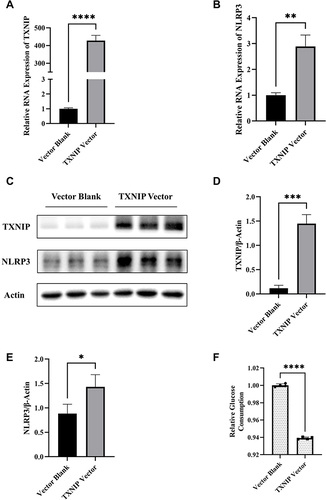
Figure 5 MiR-17-5p inhibits the expression of NLRP3 and improves cellular glucose uptake by targeting TXNIP. (A and B) The mRNA expression of TXNIP and NLRP3 in HTR8/SVneo cells transfected by mimic + TXNIP Vector, mimic + Vector Blank, mimic or mimic NC respectively. (C–E) Representative images and quantitative analysis of TXNIP and NLRP3 protein expression. (F) Relative quantitative analyses of glucose consumption. *P<0.05, **P<0.01, ***P<0.01, ****P<0.0001.
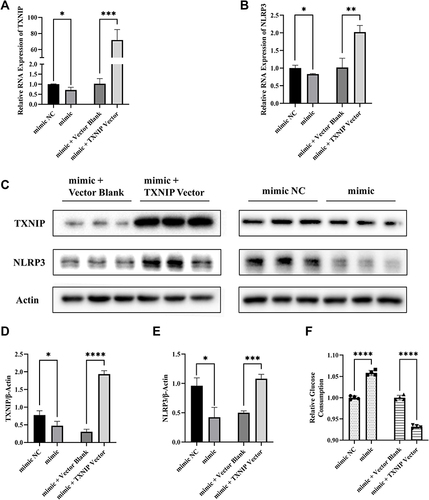
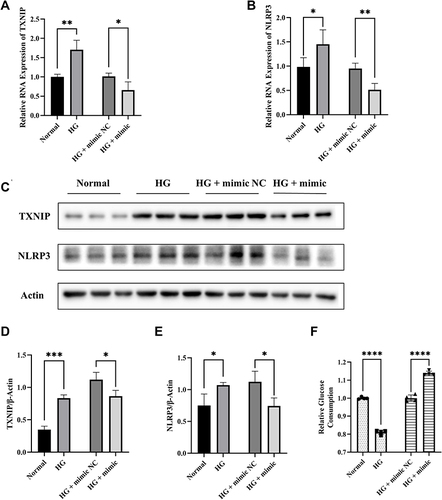
Figure 6 Effects of miR-17-5p on TXNIP, NLRP3 expression and glucose uptake in HTR8/SVneo cells treated with high-glucose. (A and B) The mRNA expression of TXNIP and NLRP3 in HTR8/SVneo cells. (C–E) Representative images and quantitative analysis of TXNIP and NLRP3 protein expression. (F) Relative quantitative analyses of glucose consumption. *P<0.05, **P<0.01, ***P<0.01, ****P<0.0001.