Figures & data
Figure 1 Flowchart of participant selection for the study cohort.
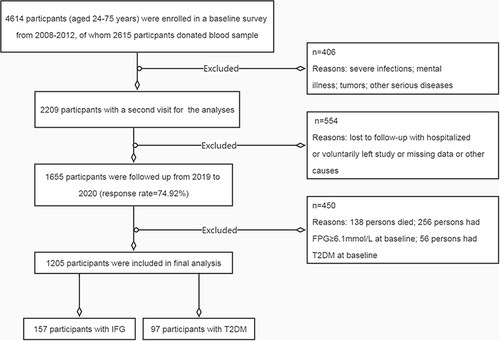
Table 1 Characteristics of Participants According to Fasting Glycemia Levels at Baseline (n=2209)
Table 2 Association of Three IR Indices with T2DM or IFG at Baseline Using Logistic Regression Analysis (n=2209)
Table 3 Cox Proportional Hazards Regression Analysis of Risk of Incident IFG by Tertile of Baseline TyG Index, TG/HDL-C Ratio and METS-IR (n=1205)
Table 4 Cox Proportional Hazards Regression Analysis of Risk of Incident T2DM by Tertile of Baseline TyG Index, TG/HDL-C Ratio and METS-IR (n=1205)
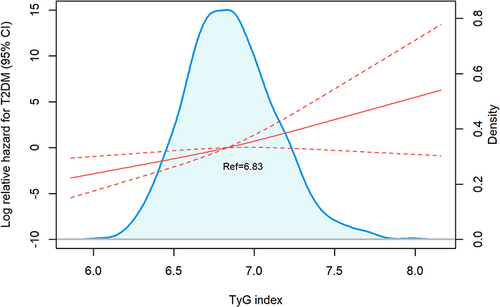
Figure 2 Linear relationship of the TyG index with risk of incident diabetes (p for linear=0.011). The model was adjusted for age, sex, educational status, cigarette smoking, drinking, physical activity, family history of hypertension and diabetes, BMI, WC, FBGSBP, TC, TG, LDL and HDL-C.