
Figures & data
Figure 1 Flow of patients included in the analysis. Patients ever admitted to hospital or lost to follow-up after insulin therapy initiation during 6-month study period were excluded.
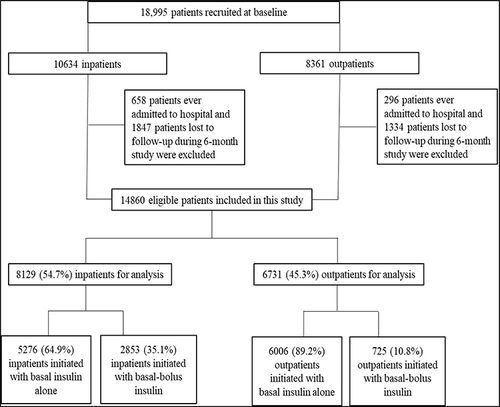
Table 1 Baseline Characteristics of Inpatients and Outpatients Initiated with Basal Insulin
Figure 2 Evolution of insulin therapy after 6-month follow-up for inpatient and outpatient initiation. (A) Treatment transition after 6 months among all patients. (B) Treatment transition after 6 months among patients initiated with basal insulin alone. (C) Treatment transition after 6 months among patients initiated with basal-bolus insulin.
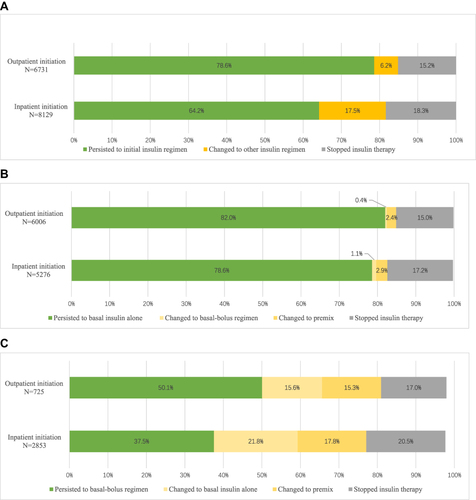
Figure 3 Proportion achieving HbA1c <7% between patients persistent or nonpersistent to initial insulin therapy after 6 months.
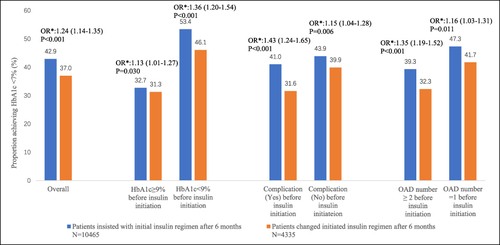
Table 2 Subgroup Analysis of Proportion Achieving HbA1c <7% Among Persistent and Nonpersistent Groups Between Inpatient Initiators and Outpatient Initiators After 6 Months
Table 3 Comparison of Proportion Achieving HbA1c <7% After 6 Months Between Inpatient and Outpatient Insulin Initiation by HOC Level Among Patients Persisting with Initial Insulin Therapy