Figures & data
Figure 1 (A) Comparison of pre-treatment fasting insulin in the 1-year IA-negative seroconversion group, the 2-year IA-negative seroconversion group, and the IA non-negative seroconversion group. (B) Comparison of pre-treatment 2-h insulin in the 1-year IA-negative seroconversion group, the 2-year IA-negative seroconversion group, and the IA non-negative seroconversion group. *P-value < 0.05, **P-value < 0.01, ***P-value < 0.001.
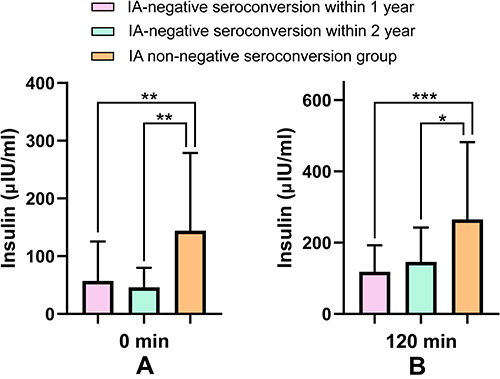
Table 1 Comparison of Conditions Before and After Treatment in Negative Converted Group and Non-Negative Converted Group
Table 2 Comparison Between Negative Converted Group and Non-Negative Converted Group After Treatment
Figure 2 Comparison of daily insulin dose, insulin at 0 minutes, and insulin at 120 minutes between the IA-negative converted group and the non-negative converted group before and after treatment. (A) In the insulin group, the insulin dose decreased after changing the treatment regimen regardless of whether IA turned negative. (B) After 2 years of treatment, the insulin at 0 and 120 minutes decreased in the OADs group and the insulin group. **P-value < 0.01, ***P-value < 0.001.
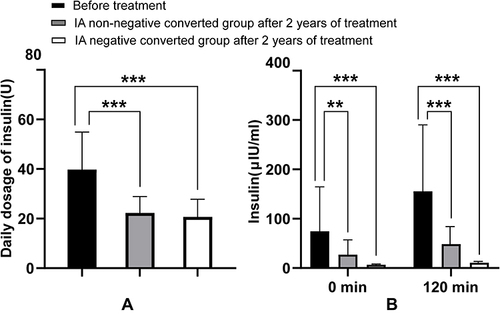
Figure 3 (A) The concentrations of C-peptide at 0 minutes and insulin at 0 minutes in the negative converted group reduced the fastest in the initial 3 months; this reduction slowed after 3 months. (B) The concentrations of C-peptide at 120 minutes and insulin at 120 minutes in the negative converted group reduced the fastest in the initial 3 months; this reduction slowed after 3 months.
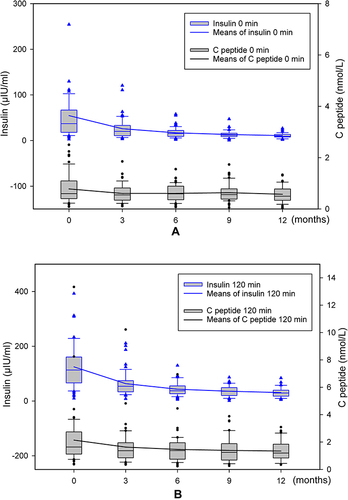
Table 3 Comparison Between OADs Group and Insulin Group Before and After Treatment
Figure 4 Comparison of C-peptide in the OADs group and the insulin group. Before and after treatment, C-peptide at 0 minutes and C-peptide at 120 minutes in the OADs group were found to be higher than in the insulin group. **P-value < 0.01, ***P-value < 0.001.
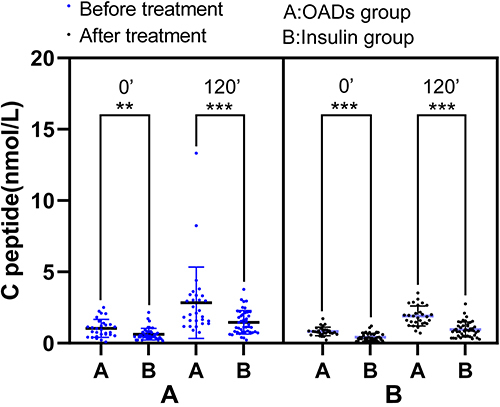
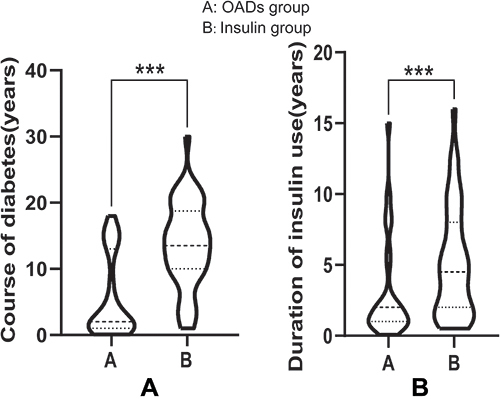
Figure 5 Comparison of course of diabetes and duration of insulin use in the OADs group and the insulin group. (A) The course of type-2 diabetes in the OADs group was significantly lower than in the insulin group. (B) The duration of insulin use in the OADs group was significantly lower than in the insulin group. ***P-value < 0.001.