Figures & data
Figure 1 Inclusion process of enrolled people.
Abbreviations: OB, obesity group (BMI ≥28.0 kg/m2); NB, normal-BMI group (18.5≤ BMI <24.0 kg/m2).
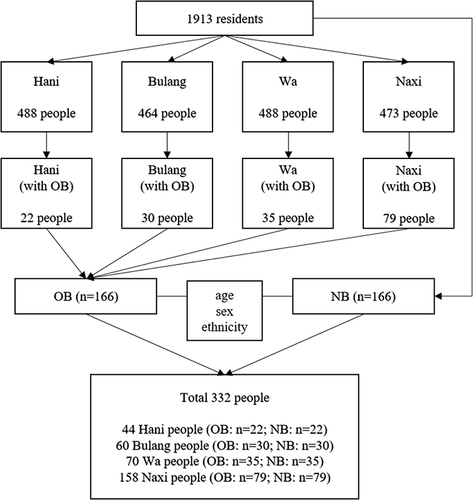
Table 1 Baseline Characteristics of Participants
Figure 2 Comparison of fatty acids among four minorities.
Notes: (A and B), comparison of dietary fatty acids among four minorities; (C and D), comparison of plasma fatty acids among four minorities. (B and D), in the same fatty acid comparison, the darker the color, the higher the content; and the different color, the difference between the groups was statistically significant; the same color indicates no significant difference between groups. P value < 0.05 was considered statistically significant.
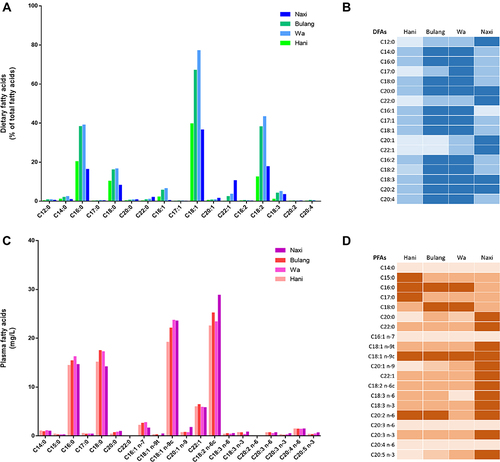
Table 2 Dietary Fatty Acids of four Minorities (% of Total Fatty Acids)
Table 3 Plasma Fatty Acids of four Minorities (mg/L)
Table 4 Conditional Logistic Regression Analysis of Obesity
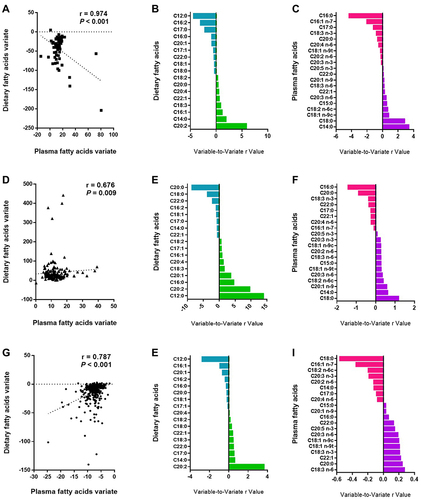
Figure 3 Canonical correlation analysis of dietary fatty acids and plasma fatty acids.
Notes: (A–C), canonical correlation analysis of dietary fatty acids and plasma fatty acids in the Bulang people; (D–F), canonical correlation analysis of dietary fatty acids and plasma fatty acids in the Naxi people; (G–I), canonical correlation analysis of dietary fatty acids and plasma fatty acids in all people. r, canonical correlation coefficient; P < 0.05 were considered significant.