Figures & data
Figure 1 Flow chart for inclusion of participants in this study.
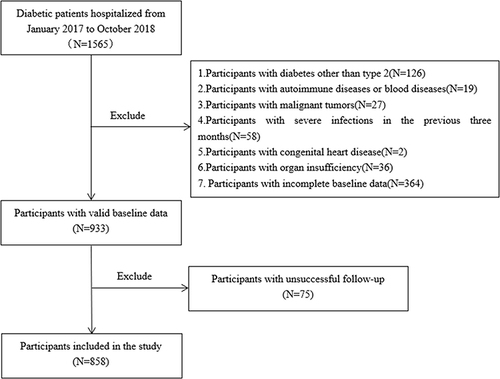
Table 1 Basic Characteristics of Participants
Table 2 Baseline Characteristics of TyG Index Quartile Groups
Table 3 Correlation Between TyG Index and Other Clinical Variables
Table 4 Logistic Regression Analysis of Related Factors with T2DM Complicated with Macrovascular Disease
Figure 2 Selecting clinical features based on the least absolute shrinkage and selection operator (LASSO) logistic regression.
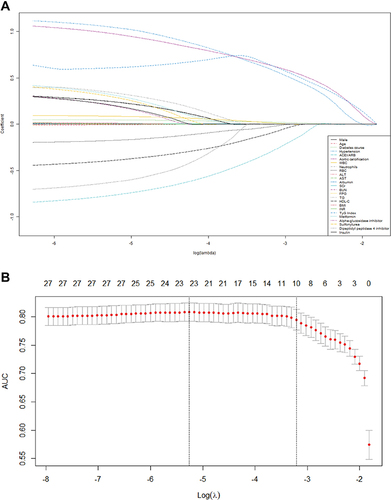
Figure 3 A nomogram was constructed to predict macrovascular complications in T2DM patients.
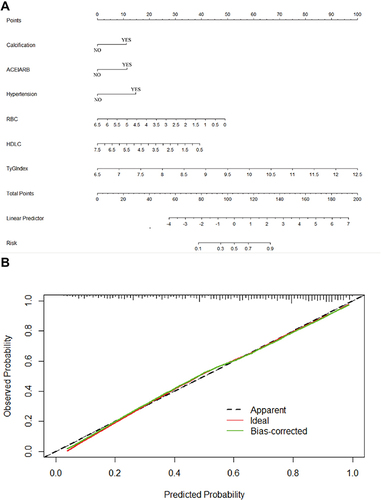
Figure 4 ROC curve of TyG index, RBC, and HDL-C in predicting T2DM complicated with macrovascular complications.
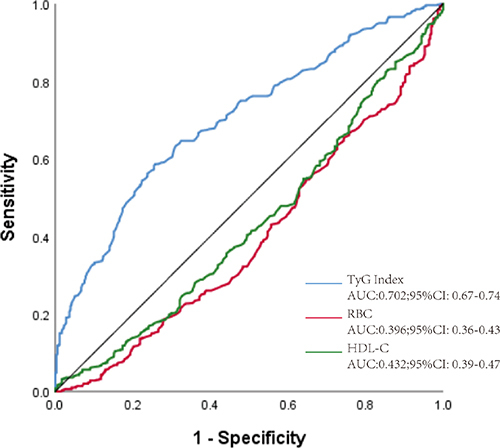
Table 5 Cox Proportional Hazards for All-Cause Mortality in T2DM with or without Macrovascular Complications
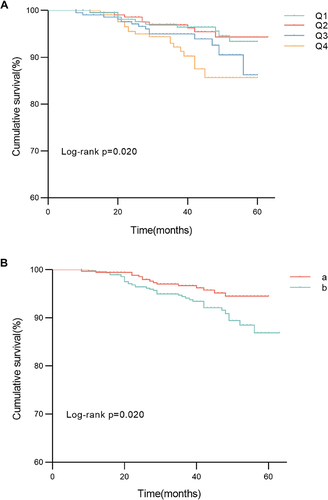
Figure 5 Association of TyG index quartiles with all-cause mortality in T2DM.
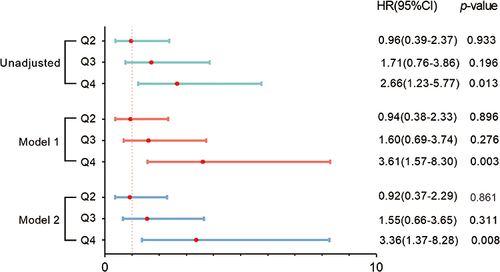
Figure 6 Prognostic analysis of patients with T2DM.