Figures & data
Figure 1 Flow chart of the study.
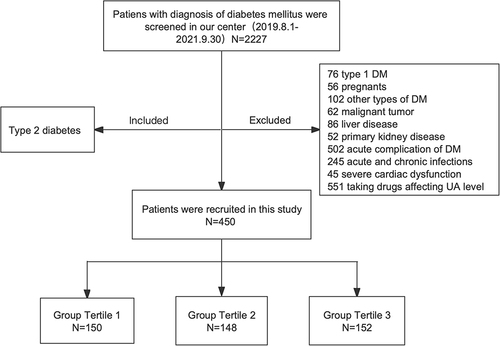
Table 1 Characteristics of T2DM Patients According to the SUA/SCr Tertiles
Figure 2 Prevalence of eGFR and UACR among three groups categorized by tertile of SUA/SCr. (A) Comparison of eGFR among the three groups; (B) Comparison of UACR among the three groups.
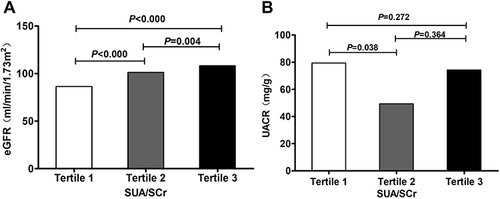
Figure 3 Prevalence of carotid lesions and LLAL among three groups categorized by tertile of SUA/SCr. (A) Comparison of the prevalence of carotid lesions among the three groups; (B) Comparison of the prevalence of LLAL among the three groups.
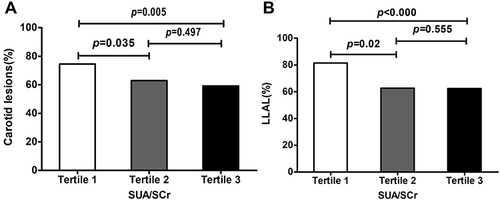
Table 2 Correlation Between SUA/SCr and Other Parameters in T2DM Patients
Table 3 Logistic Regression Analysis of SUA/SCr for DKD in T2DM Patients
Table 4 Logistic Regression Analysis of SUA/SCr for Macroangiopathy in T2DM Patients
Figure 4 The ROC curves of SUA/SCr for DKD in T2DM.
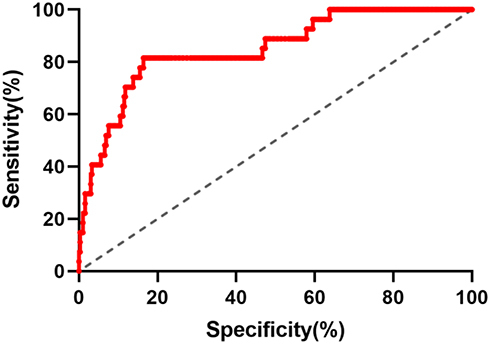
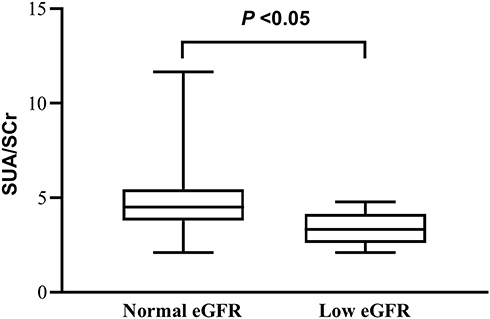
Figure 5 Comparison of SUA/SCr levels according to eGFR among patients with normal UACR.