Figures & data
Table 1 Baseline Patient Characteristics by Obesity Category
Figure 1 Marked microbiota dysbiosis in obesity. (A) Microbial diversity was estimated based on Shannon index in healthy controls (n = 36) and obese (n = 56) subgroups. Different lowercase letters indicate significant differences (P < 0.05). (B) Based on the Unweighted Unifrac distance, PCoA was used to show beta diversity between the groups. (C) Venn diagram of shared or unique ASVs between healthy controls and obese patients. (D) Relative frequency of the top 8 species in the healthy control and obesity subgroups. (E) Microbial biomarker analysis between the groups by Linear discriminant analysis effect size (LEfSe) analysis, LDA score > 4.0.
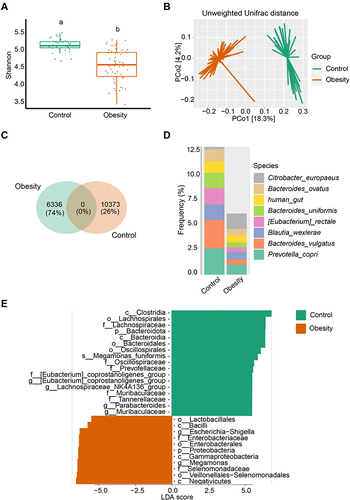
Figure 2 Microbial changes between different degrees of obesity. (A) Shannon diversity in subjects from the Normal, “Overweight”, Class I, Class II, and Class III obesity groups. Different lowercase letters indicate significant differences (P < 0.05). (B) Beta diversity of Unweighted Unifrac distances in patients from different groups based on PCoA. (C) Venn diagram of shared or unique ASVs between the 5 groups. (D) Bar plot of the mean relative abundance of top 15 genera between different groups. (E) Top 15 taxonomic species are shown for different degrees of obesity.
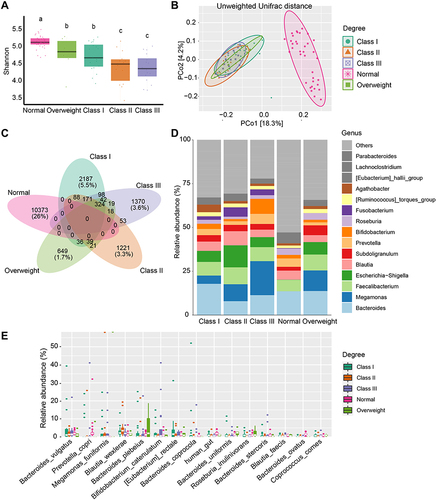
Figure 3 Microbial biomarkers and correlation with different degrees of obesity. (A and B) Biomarker analysis between groups by LEfSe, LDA score > 4.0 (A), and RF (B).
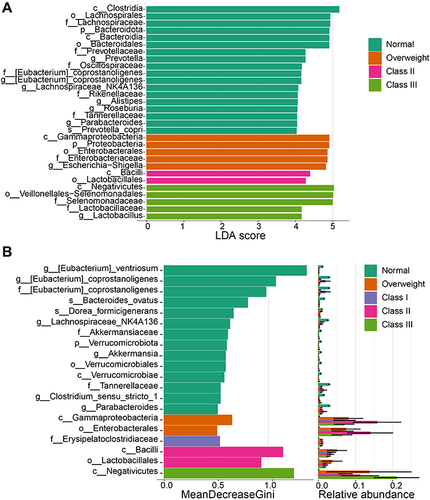
Figure 4 Relationship within microbiota and obese clinic traits in obesity. (A) Relationship between clinic data and alpha diversity. (B) Correlation analysis between clinic data and some important taxa, as detected in RF biomarker analysis. * P < 0.05, ** P < 0.01, *** P < 0.001.
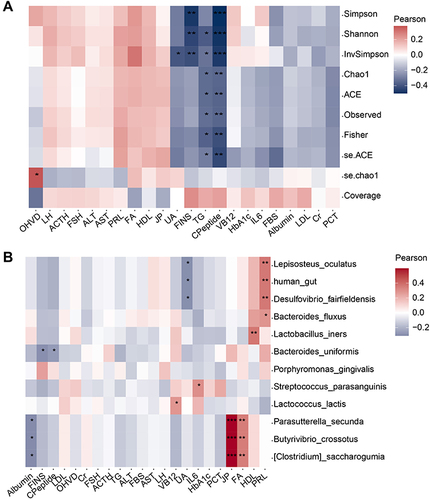
Figure 5 Alterations in the predicted metagenome functions in different obesity classes. (A) Heatmap of significantly different pathways between different groups. P < 0.001, Effect size > 0.4. (B-H) Key pathways in obesity: TCA cycle VII (acetate-producers) (B), taxadiene biosynthesis (engineered) (C), superpathway of polyamine biosynthesis II (D), superpathway of polyamine biosynthesis I (E), superpathway of arginine and polyamine biosynthesis (F), superpathway of L-tyrosine biosynthesis (G), and superpathway of L-phenylalanine biosynthesis (H).
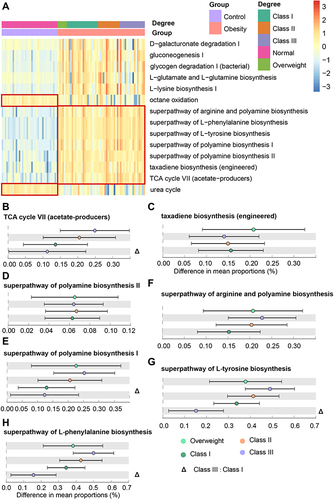
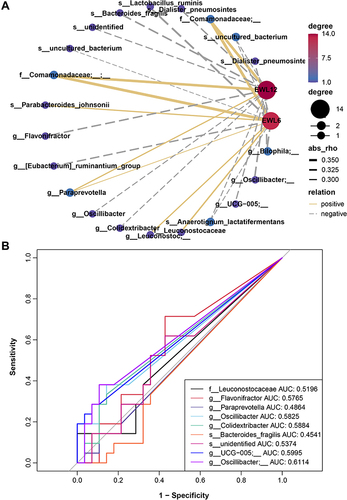
Figure 6 Correlation between baseline gut microbiota and weight loss achievement after bariatric surgery. (A) Spearman correlation network of microbiota and weight loss. Node and edge sizes indicate the degree and absolute values of the correlation, respectively. Edges represent the interaction between nodes, and negative and positive correlations are denoted by dashed gray lines and solid yellow lines, respectively. (B) Receiver operating characteristic (ROC) analysis of the microbiota signature for the relationship of microbiota and weight loss.