
Figures & data
Figure 1 Flowchart of the inclusion and exclusion of participants.
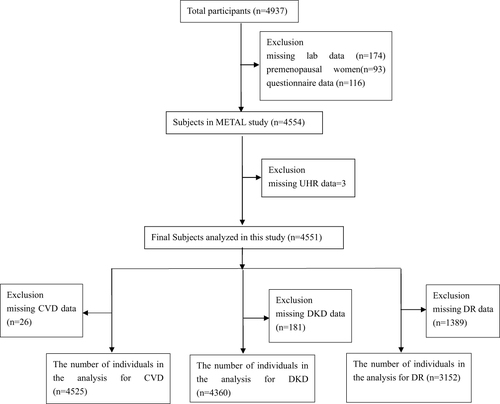
Table 1 Characteristics of the Participants by Gender
Table 2 The Correlation Between UHR and Cardiometabolic Risk Factors After Adjusted by Age, Sex and BMI
Figure 2 Odds ratios for diabetes macrovascular and microvascular complications at UHR quartiles. Data are expressed as regression coefficients or odds ratios (95% CI). Model 1 was adjusted for age, sex, BMI, smoke status and drink status. Model 2 was adjusted for model 1 plus TC, LDL, HbA1c, eGFR (only in CVD and DR group), systolic blood pressure, diastolic blood pressure, anti-diabetes agents, hypertension, antihypertension drug.
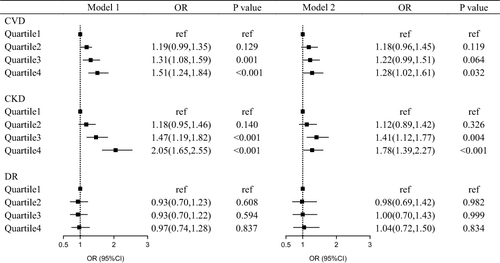
Table 3 Odds Ratios for Macrovascular and Microvascular Complications According to UHR Quartiles by Various Subgroups