Figures & data
Table 1 Comparison of the Clinical Parameters of the 4 SUA Groups
Figure 1 Comparison of TyG and HOMA-IR between male and female patients. (A) Comparison of TyG between male and female patients; (B) Comparison of HOMA-IR between male and female patients. *P < 0.05.
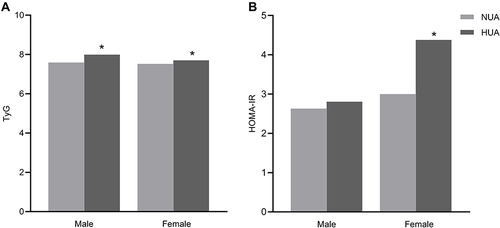
Figure 2 Comparison of SUA between FL subgroups and BMI subgroups. (A) Comparison of SUA between NFL group and FL group; (B) Comparison of SUA between non-overweight group and overweight group. **P < 0.01.
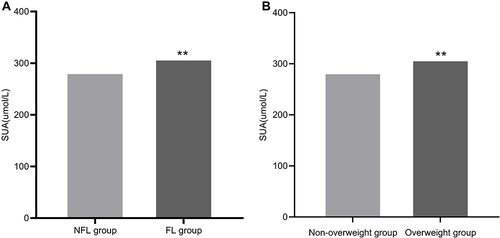
Table 2 Correlation Between the SUA and Other Factors
Table 3 Logistic Regression Analysis of TyG and HUA
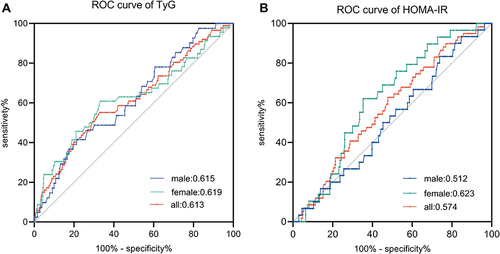
Table 4 The Diagnostic Value of TyG and HOMA-IR for HUA in Non-Obese Patients with T2DM
Figure 3 ROC curve of TyG and HOMA-IR in predicting HUA in non-obese patients with T2DM. (A) ROC curve of TyG in predicting HUA; (B) ROC curve of HOMA-IR in predicting HUA.