Figures & data
Table 1 Clinical Characteristics in Patients with Untreated PCOS
Figure 1 Comparison of microbial community characteristics between three groups with PCOS from fecal metagenomic sequencing. (A) β-diversity was evaluated by Principal Coordinate analysis (PCoA) based on Bray-Curtis distance and permutation multivariate analysis of variance (PERMANOVA) between groups. (B) Venn diagram of unique or common species between groups.
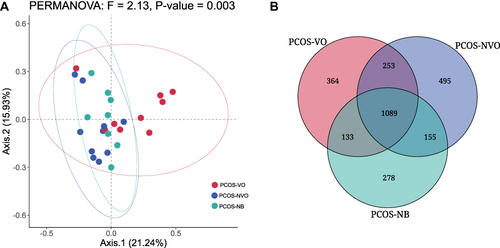
Figure 2 Relative abundance of gut microbiota in 27 patients with PCOS. (A) Microbial histogram analysis at the kingdom level for each sample. Microbial histogram analysis at the phylum level (B, top 5), the family level (C, top 10), and the genus level (D, top 20) for each group. The abbreviations for kingdom, phylum, class, order, family, genus, and species are k, p, c, o, f, g and s, respectively.
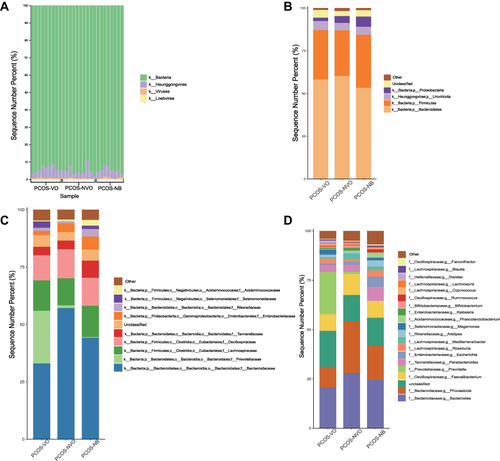
Table 2 Comparison of Relative Abundance of Microbial Genera Among PCOS Patients
Figure 3 Enriching microbial taxa in PCOS patients of each group and their correlations with clinical parameters. (A) LEfSe identified significant abundant taxa in each group (LDA score (log 10)>3, p<0.05). The abbreviations for kingdom, phylum, class, order, family, genus, and species are k, p, c, o, f, g and s, respectively. (B) Network analysis of correlations among enriching microbial taxa at the genus level. The size of ellipse denotes the relative abundance of the genus. The red and green lines denote positive and negative correlations, respectively. Only top 30 genera in abundance are counted and mapped. Only r>0.4 or r<-0.4, and P<0.05 is displayed a line. Microbial taxa from different phyla are shown by different colors on the right. (C) Heatmap of correlations between clinical parameters and microbial taxa at the genus level. Microbial taxa with top 30 abundance detected in samples are listed on the left, and clinical parameters are shown on the bottom. Microbial taxa from different phyla are shown by different colors on the right. R values are shown in different colors, and only r>0.4 or r<-0.4, and P<0.05 are marked. *Means 0.01≤P<0.05, ** means 0.001≤P<0.01, *** means P<0.001.
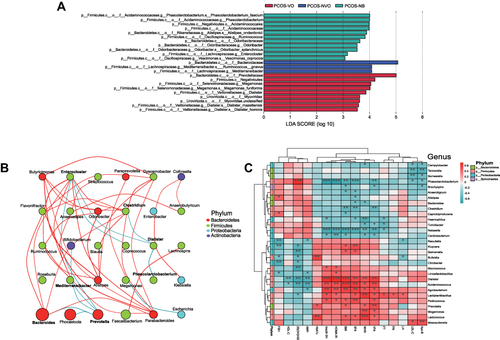
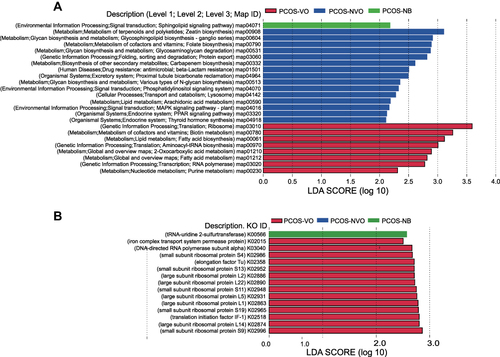
Figure 4 Functional annotation of gut microbiota of 27 PCOS patients from metagenomic sequencing data. Linear discriminant analysis (LDA) effect size (LEFSe) was used to identify KEGG pathways (A) and KOs (B) with significant differences in relative abundance between groups. LDA>2 for KEGG pathways or LDA>2.5 for KOs, and p<0.05 are listed.