Figures & data
Figure 1 Flow chart of the selection of study participants.
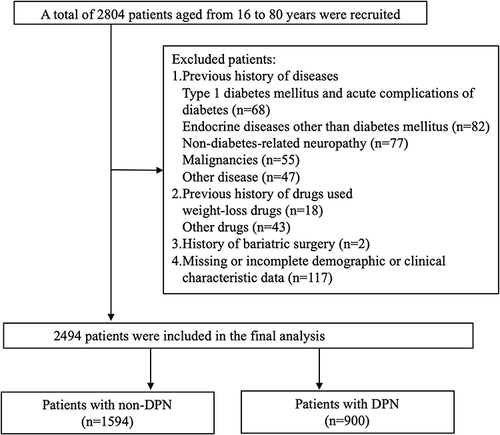
Table 1 Clinical and Biochemical Characteristics of Patients Stratified by Presence of DPN
Figure 2 Comparison of VFA levels between non-DPN and DPN groups. *P < 0.01 vs non-DPN group.
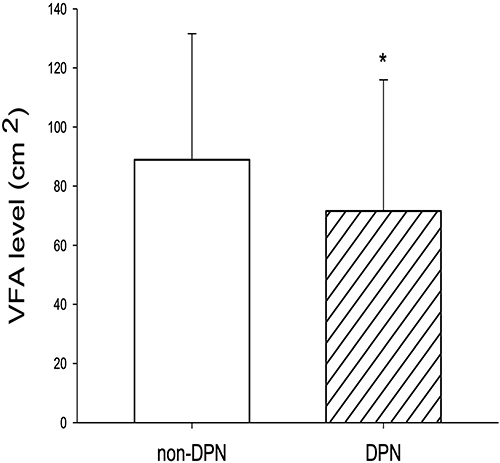
Table 2 Relationship Between VFA and Risk Factors Associated with DPN in Study Participants
Table 3 OR and 95% CI of the Risk of DPN According to VFA Quartiles
Table 4 The Result of Two-Piecewise Linear Regression Model
Figure 3 Multivariate adjusted smoothing spline plots of the Risk of DPN hospitalized patients with T2DM. We adjusted parameters such as anthropometry, glucolipid metabolism, inflammation, oxidative stress, and diabetic vasculopathy in Model 5 of . The solid red line represents the best-fit line, and the dotted blue lines are 95% confidence intervals.
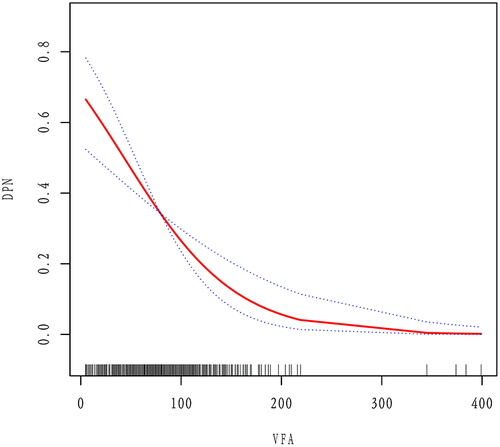
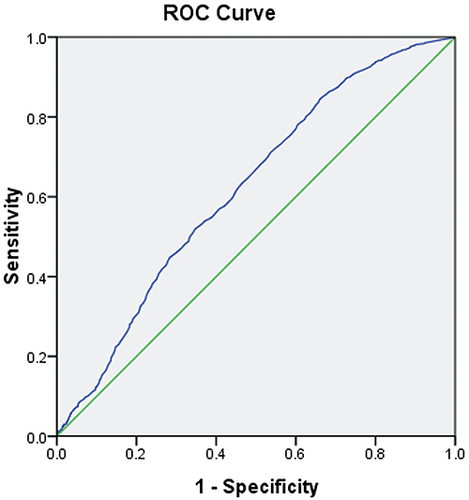
Figure 4 ROC analysis of visceral fat area (VFA) to predict the presence of DPN in T2DM patients. AUC = 0.621; 95% CI, 0.597–0.644; P<0.001; identified VFA cutoff value = 50.5 cm2; Youden index = 0.184; sensitivity: 84.40%; specificity: 34.00%.