
Figures & data
Table 1 Clinical Characteristics of the Participants According to Sex
Figure 1 Serum omentin levels in male and female participants.
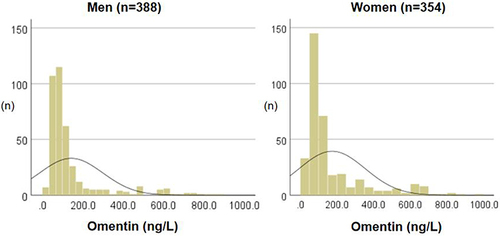
Table 2 Clinical Characteristics of the Participants According to Their Omentin Levels
Table 3 Partial Correlation Between Omentin Level and MetS Risk Factors
Table 4 Association of Omentin Level with MetS and MetS Components
Table 5 Association of Omentin Level with BMI