Figures & data
Figure 1 Flow chart of data preparation, processing and analysis.
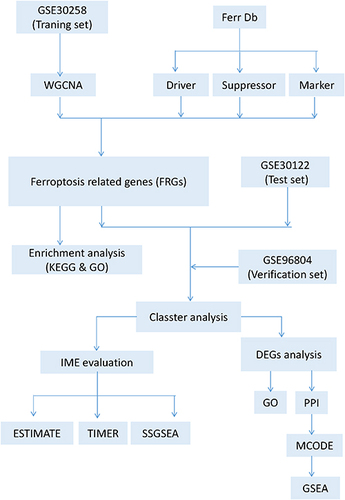
Figure 2 Preprocessing of WGCNA. (A) Hierarchical clustering of module hub genes that summarize the modules yielded in the clustering analysis. (B) Analysis of the scale-free fit index for various soft-thresholding powers, and the mean connectivity for various soft-thresholding powers. (C) The cluster dendrogram of genes in GSE30528. (D) Interaction relationship analysis of co-expressed genes. (E) Heatmap plot of the adjacencies in the hub gene network.
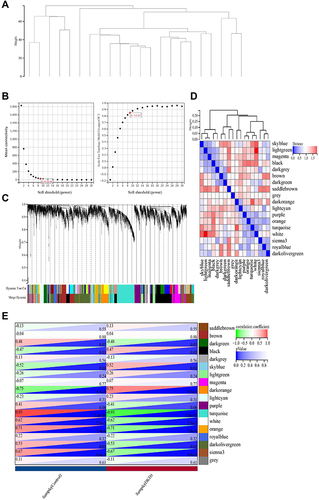
Figure 3 Ferroptosis-related Genes (FRGs) in hub gene modules. (A–E) Gene Significance (GS) for weight vs Module Membership (MM) in orange, turquoise, white, dark orange and sienna3 module. (F) Venn diagram to find the FRGs in 5 hub modules.
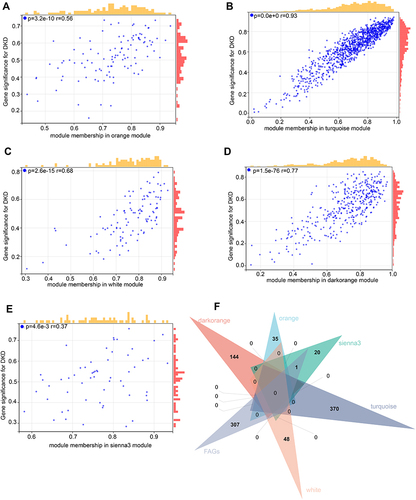
Figure 4 The results of enrichment analysis for ferroptosis-related genes (FRGs). (A) The GO analysis. (B) The KEGG enrichment analysis.
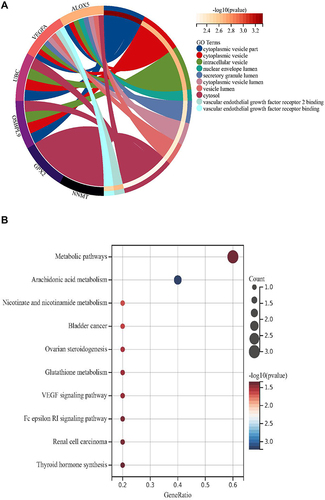
Figure 5 Consensus cluster based on ferroptosis-related genes (FRGs). (A-C) k = 2 was identified the optimal value for consensus clustering.
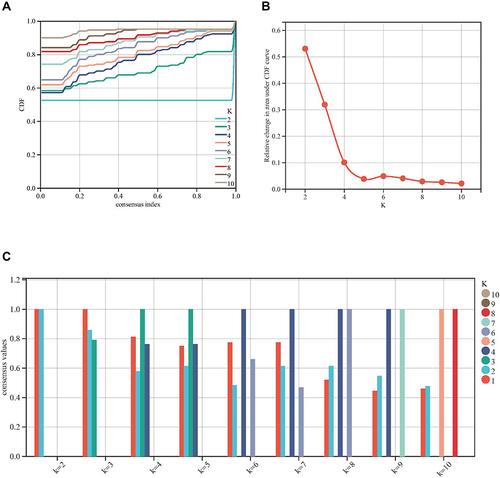
Figure 6 Immune analyses in the 2 clustered molecular subtypes. (A) The expression profile of DKD samples were divided into 2 subtypes; (B) The heatmap visualizing the expression of ferroptosis-related genes (FRGs) in the 2 subtypes; (C-E) ESTIMATE, TIMER and ssGSEA algorithm was further performed to analyze their cell type signature.
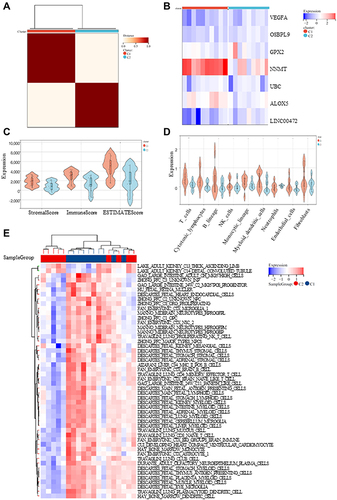
Figure 7 The differentially expressed genes (DEGs) analysis between the clustered subtypes. (A) Volcano map; (B) The heatmap; (C) The visualizing the biological processes enriched by GO analysis.
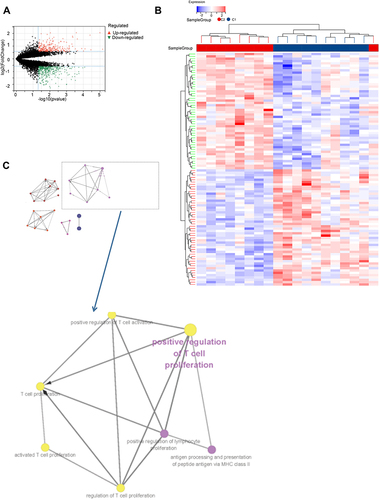
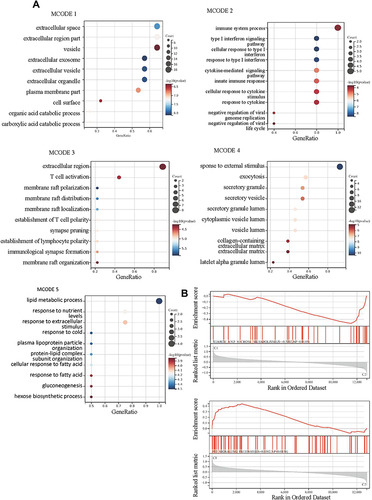
Figure 8 PPI network was constructed and five submodels were identified by MCODE plug-in. (A) PPI network of all DEGs; (B-F) Five submodels identified by MCODE.
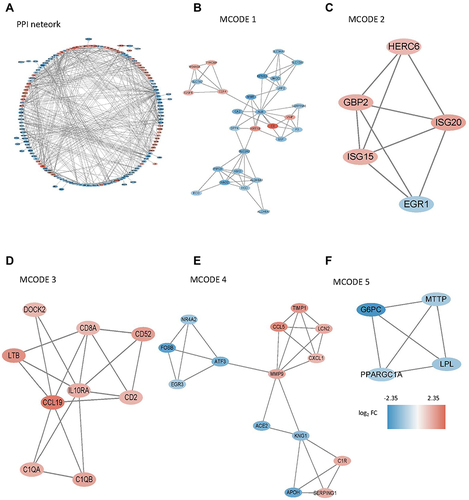
Figure 9 The results of enrichment analysis for differentially expressed genes (DEGs) between the clustered subtypes. (A) GO analysis in 5 MCODE; (B) GSEA.