
Figures & data
Figure 1 Pharmaceutical care process.
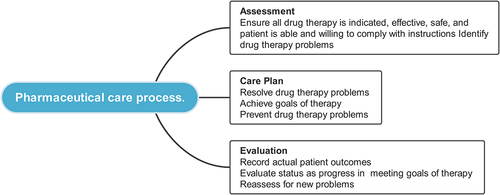
Figure 2 Insulin staging.
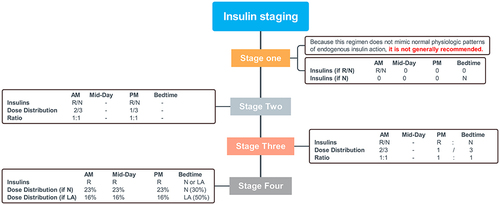
Table 1 Characteristics of Study Population
Figure 3 DTPs among intervention group 1st visit.
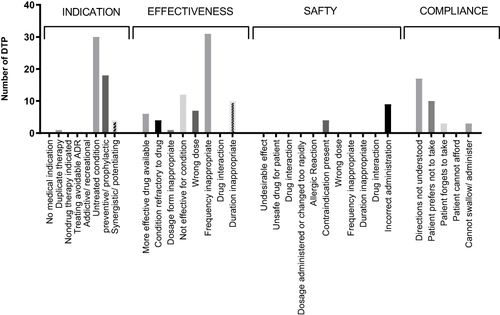
Figure 4 DTPs among intervention group 2nd visit.
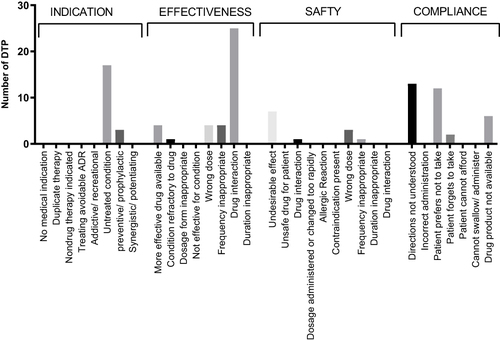
Figure 5 DTPs among intervention group 3rd visit.
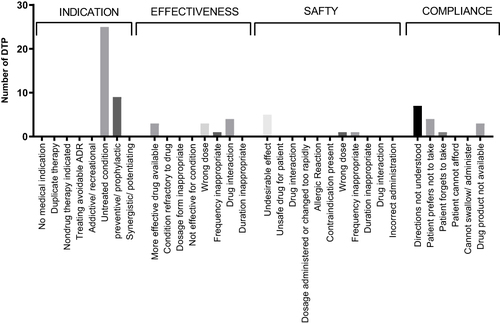
Figure 6 DTPs among non-intervention group 1st visit.
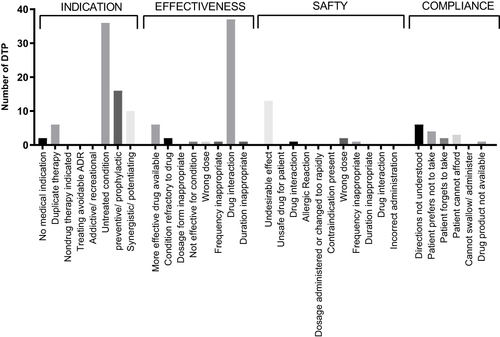
Figure 7 DTPs among non-intervention group 2nd visit.
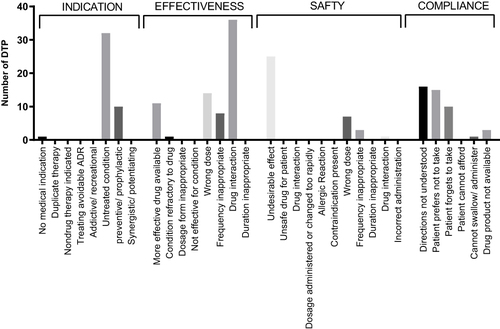
Figure 8 DTPs among non-intervention group 3rd visit.
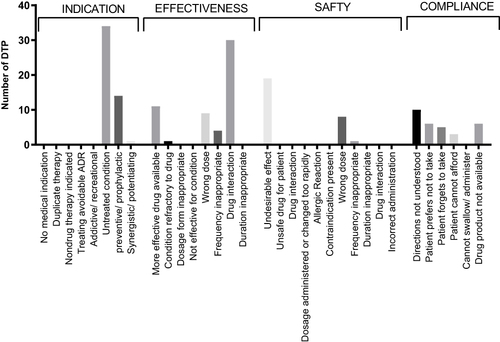
Figure 9 DTP change in intervention and non-intervention group.
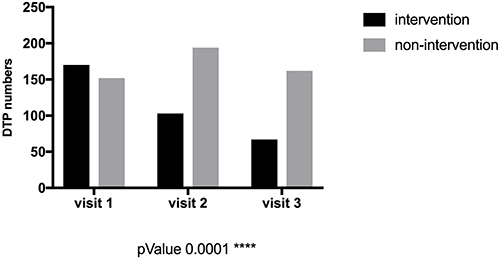
Table 2 Change in Body Mass Index (BMI) Over 6 Months
Figure 10 Changes in HbA1c among the intervention group.
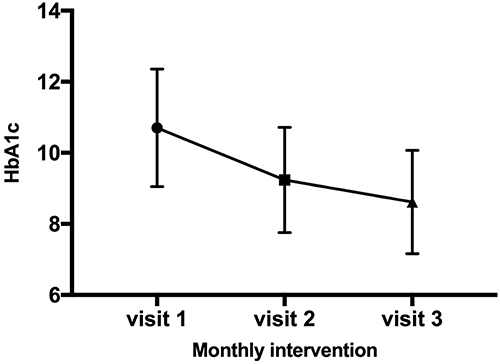
Figure 11 FPG changes among the intervention group.
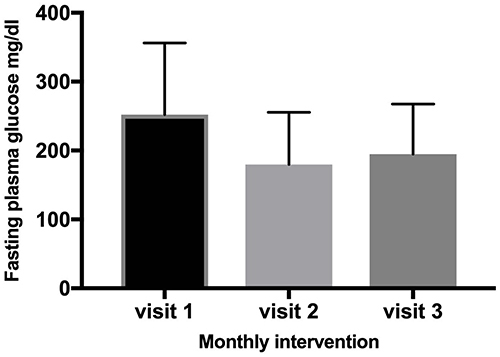
Figure 12 Changes in HbA1c among the non-intervention group.
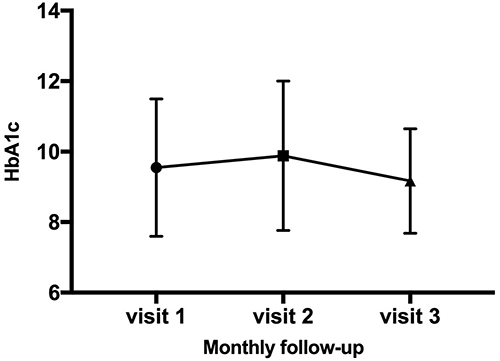
Figure 13 FPG changes among the non-intervention group.
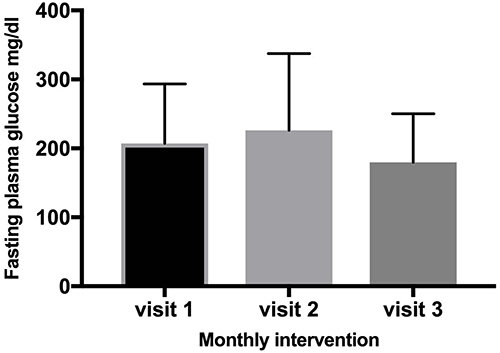
Figure 14 Lipid profile in intervention and non-intervention group.
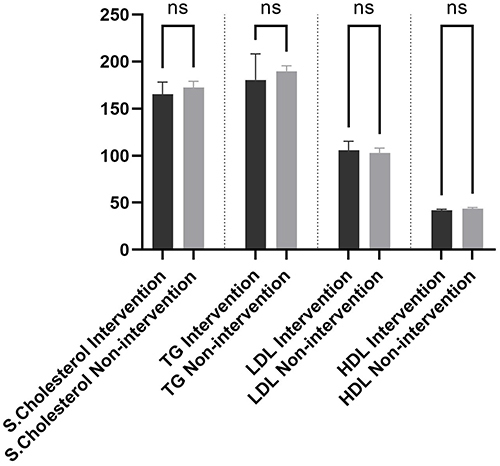
Table 3 Number of DTPs at First Visit