
Figures & data
Table 1 Patient Characteristics
Figure 1 Flow chart of the study. A total of 396 patients with type 2 diabetes mellitus (T2DM) were recruited. After applying the inclusion and exclusion criteria, 146 patients were excluded. Finally, 250 patients with T2DM (142 female and 108 male patients) were included in the analysis.
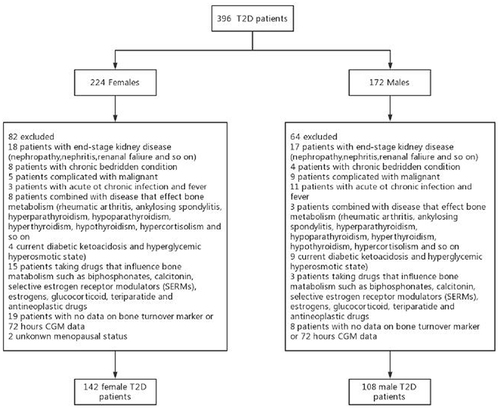
Table 2 Univariable Regression Analysis of the Correlation Between Bone Markers and Demographic/Biochemical Datas
Figure 2 Scatterplot and regression line of C-terminal telopeptide fragments of type-I collagen (β-CTX) and N-terminal propeptide of type 1 collagen (P1NP) levels by the mean amplitude of glycemic excursions (MAGE). (A) The β-CTX by MAGE in female patients with T2DM, (B) P1NP by MAGE in female patients with T2DM, (C) β-CTX by MAGE in male patients with T2DM, and (D) P1NP by MAGE in male patients with T2DM.
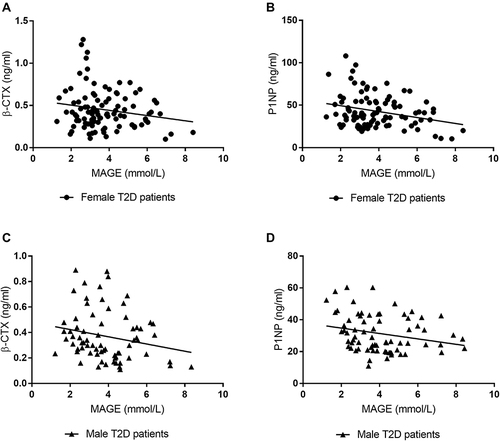
Table 3 Multivariable Regression Analysis of the Correlation Between Bone Markers and Glycemic Variability