Figures & data
Table 1 Clinical and Biochemical Characteristics of T2D-NCF Group and T2D-MCI Group
Figure 1 Flow chart showing the patients included in the study.
Abbreviations: T2D, type 2 diabetes; NCF, normal cognitive function; MCI, mild cognitive impairment.
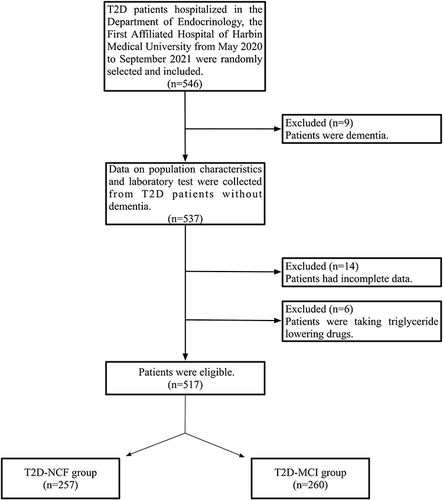
Table 2 Associations Between TyG Index and MCI
Table 3 Associations Between TyG-BMI and MCI
Figure 2 The ROC curve of the TyG index, TyG-BMI, TG, and HbA1c for diagnosing.
Abbreviations: TyG, triglyceride glycemic; TyG-BMI, triglyceride glycemic-body mass index; TG, triglyceride; HbA1c, hemoglobinA1c.
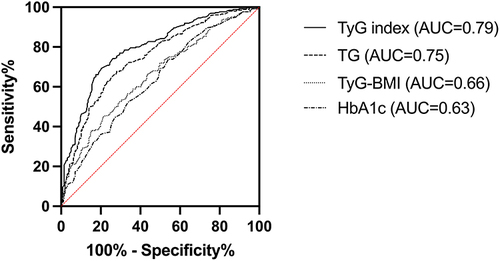
Figure 3 Nomogram showed the risk of MCI.
Abbreviation: TyG, triglyceride glycemic.
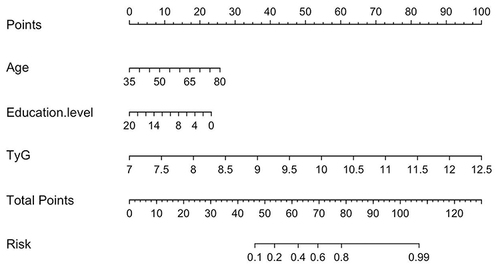
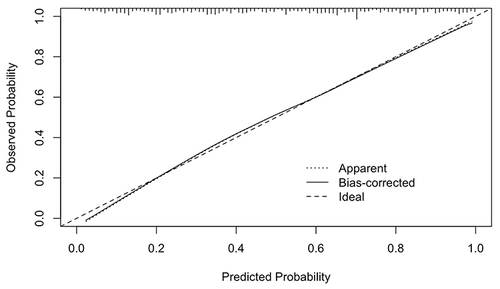
Figure 4 The calibration curve of the nomogram model.