
Figures & data
Table 1 Patient Demographics According to BMI
Table 2 Patient Demographics According to Gender
Figure 1 Mean changes in measures of weight loss and glycemic control from baseline to 1 years.
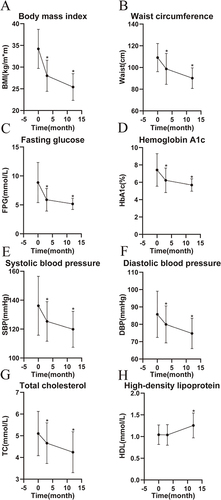
Figure 2 Mean changes in measures of weight loss and glycemic control from baseline to 1 years between the 2 groups. (BMI ≥ 35kg/m2 versus BMI < 35kg/m2).
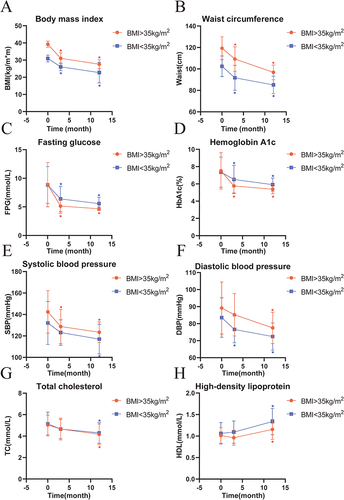
Figure 3 Mean changes in measures of weight loss and glycemic control from baseline to 1 years between the 2 groups. (Male versus Female).
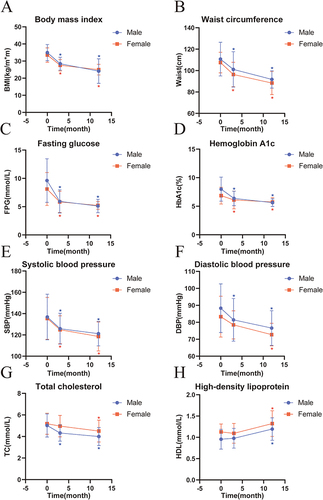
Table 3 10-Yr Cardiovascular Risk Between BMI ≥ 35 kg/m2 and BMI < 35 kg/m2
Table 4 10-Yr Cardiovascular Risk Between Male and Female
Table 5 30-Yr Cardiovascular Risk Between BMI ≥ 35 kg/m2 and BMI < 35 kg/m2
Table 6 30-Yr Cardiovascular Risk Between Male and Female
Table 7 10-Year Cardiovascular Risk of Different Modal Before and 1 Year After Surgery