
Figures & data
Table 1 Participant Demographic and Background Characteristics
Table 2 Area Under the ROC Curve, Sensitivity, and Specificity of Capillary Blood Glucose Measurements with Respect to the Gold Standard (Venous Plasma Glucose Measurements)
Table 3 Sensitivity and Specificity of Different Cutoff Points from the Fasting Capillary Blood Glucose Test
Table 4 Sensitivity and Specificity of Different Cutoff Points from the 1-h Capillary Blood Glucose Test
Table 5 Sensitivity and Specificity of Different Cutoff Points from the 2-h Capillary Blood Glucose Test
Figure 1 Area under the receiver operating characteristic curve of capillary blood and each glucose measurement with respect to the gold standard (venous plasma glucose measurement).
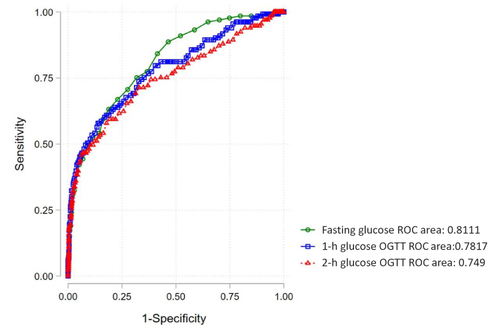
Table 6 Rate of True Positives, False Positives, and False Negatives for Capillary Blood Glucose Measurements