
Figures & data
Table 1 Clinical and Anthropometric Features of the KPT2D and NKT2D Groups
Table 2 Laboratory Findings in the KPT2D and NKT2D Groups
Figure 1 Distribution of the 25OHD levels in the two groups.
Notes: Comparison of the 25OHD levels between the KPT2D and NKT2D groups, P = 0.011.
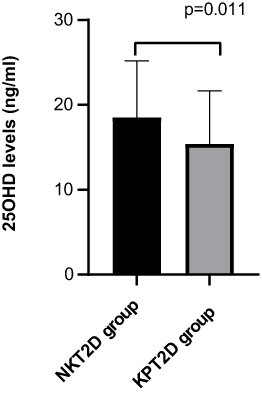
Table 3 Correlation Between the 25OHD Level and a Variety of Parameters
Figure 2 Correlational analysis of the 25OHD levels with HOMA-β and HOMA-IR in all subjects.
Notes: (A) The correlational analysis between the 25OHD level and HOMA-β, P = 0.031; (B) the correlational analysis between the 25OHD level and HOMA-IR, P = 0.616.
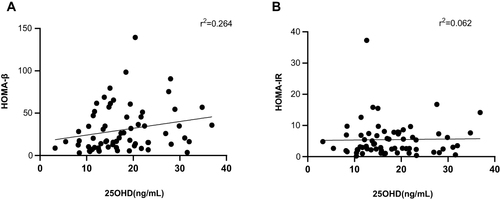
Table 4 Parameters of the Binary Logistic Regression Model