
Figures & data
Table 1 Characteristics of the Subjects According to Osteocalcin Quartiles
Figure 1 Comparisons of MAFLD prevalence and serum OCN levels stratified by sex, age, and DD. (A) Overall prevalence of MAFLD in the subjects and comparison of the MAFLD prevalence between men and women (P = 0.003). (B) Comparison of the MAFLD prevalence among the subjects stratified by age after controlling for sex and diabetes duration (DD) (P < 0.001 for trend). (C) Comparison of the MAFLD prevalence among the subjects stratified by DD after controlling for sex and age (P < 0.001 for trend). (D) Comparison of serum osteocalcin (OCN) levels between men and women (P = 0.001). (E) Comparison of serum OCN levels among the subjects stratified by age after controlling for sex and DD (P = 0.057 for trend). (F) Comparison of serum OCN levels among the subjects stratified by DD after controlling for sex and age (P = 0.091 for trend).
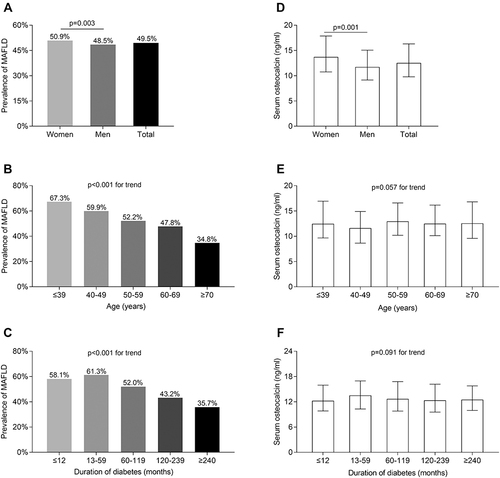
Figure 2 Comparisons of metabolic dysfunction-associated fatty liver disease (MAFLD) prevalence. (A) Comparisons of the prevalence of MAFLD across the serum osteocalcin (OCN) quartiles after controlling for sex, age, and diabetes duration (P < 0.001 for trend). (B) Comparisons of serum OCN levels between the type 2 diabetes mellitus patients with and without MAFLD (P < 0.001).
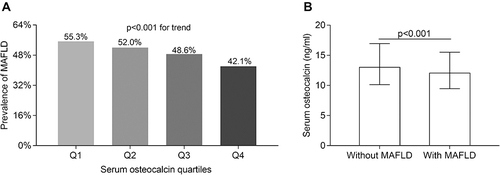
Figure 3 Comparisons of liver enzymes. (A) Comparisons of alanine aminotransferase (ALT) between type 2 diabetes mellitus (T2DM) patients with and without metabolic dysfunction-associated fatty liver disease (MAFLD) after controlling for age, sex, and diabetes duration (DD) (P < 0.001). (B) Comparisons of ALT across the serum osteocalcin quartiles after controlling for age, sex, and DD (P = 0.007 for trend). (C) Comparisons of γ-glutamyltransferase (γ-GT) between T2DM patients with and without MAFLD after controlling for age, sex, and DD (P < 0.001). (D) Comparisons of γ-GT across the serum OCN quartiles after controlling for age, sex, and DD (P = 0.001 for trend).
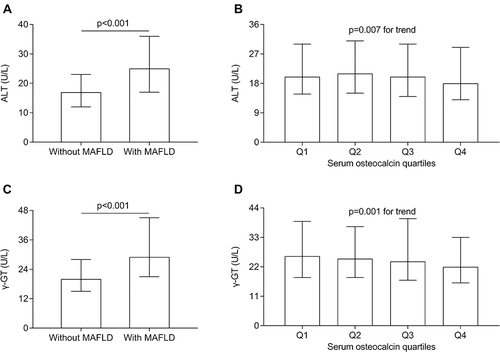
Figure 4 Comparisons of insulin resistance parameters and C-reactive protein (CRP). (A) Comparison of homeostasis model assessment of insulin resistance (HOMA-IR) between the type 2 diabetes mellitus (T2DM) patients with and without metabolic dysfunction-associated fatty liver disease (MAFLD) after controlling for age, sex, and diabetes duration (DD) (P < 0.001). (B) Comparisons of HOMA-IR across the serum osteocalcin (OCN) quartiles after controlling for age, sex, and DD (P = 0.001 for trend). (C) Comparison of HOMA2-IR between the T2DM patients with and without MAFLD after controlling for age, sex, and DD (P < 0.001). (D) Comparisons of HOMA2-IR across the serum OCN quartiles after controlling for age, sex, and DD (P = 0.068 for trend). (E) Comparison of serum CRP levels between the T2DM patients with and without MAFLD after controlling for age, sex, and DD (P < 0.001). (F) Comparisons of serum CRP levels across the serum OCN quartiles after controlling for age, sex, and DD (P < 0.001 for trend).
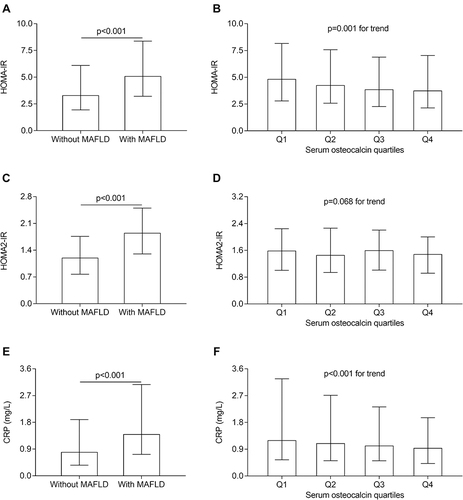
Table 2 The Association of Serum Osteocalcin Levels with MAFLD