
Figures & data
Figure 1 Flowchart for the selection of study participants.
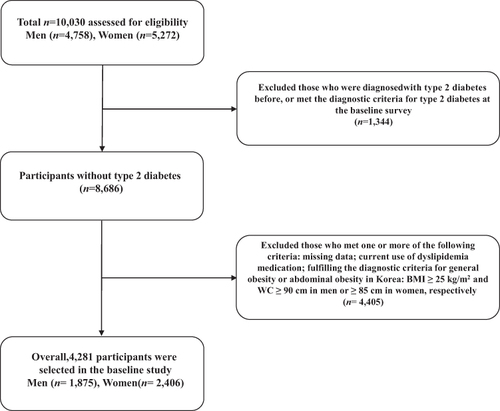
Table 1 Baseline Characteristics of the Study Population According to Lipid Accumulation Product Quartiles
Table 2 Incidence of Type 2 Diabetes During the Follow-Up Study
Figure 2 Kaplan–Meier plots indicating the cumulative probability of being diagnosed with diabetes after the baseline survey.
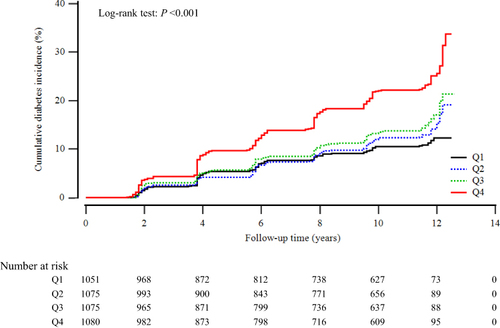
Figure 3 Age- and sex-adjusted LAP index at baseline according to the incidence of diabetes.
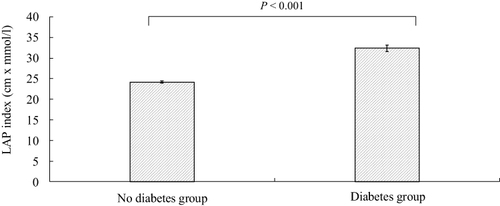
Table 3 Hazard Ratios and 95% Confidence Intervals for Incident Type 2 Diabetes According to LAP Quartiles
Table 4 Sex-Based Subgroup Analysis for Incident Type 2 Diabetes According to LAP Quartiles
Table 5 LAP Index versus body Mass Index, Waist circumference and HOMA-IR for predicting type 2 Diabetes