Figures & data
Figure 1 Comparison of body weight and biochemical indexes among four groups. (A) Their body weights were measured. (B and C) FBG and HbA1c were measured in the blood samples of each group. (D–F) The UAlb/UCR, UPCX/UCR, and URBP/UCR of each group of urine samples were measured separately. Data are expressed as the mean ± SD. *P<0.05 vs NC group; #P<0.05 vs T2DM group; ΔP<0.05 vs GLIB group.
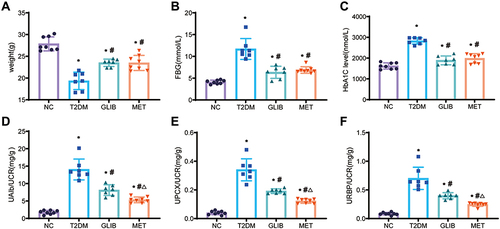
Figure 2 Metformin ameliorates tubular EMT in T2DM mice. (A) HE staining of kidney tissue in each group (scale bar, 50 µm) (Significant kidney damage is indicated by red arrows). (B) Immunohistochemistry of SMA and Ecad expression in the kidneys. (C) Quantification of SMA and Ecad protein detected by IHC staining. Data are expressed as the mean ± SD. *P<0.05 vs NC group; #P<0.05 vs T2DM group; ΔP<0.05 vs GLIB group.
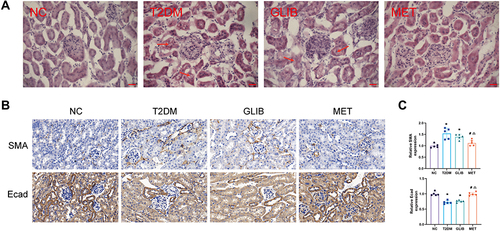
Figure 3 Metformin intervention upregulates the expression of VDR in the kidneys of T2DM. (A) The expression of VDR in kidney tissues of each group was verified by qRT-PCR. (B and C) Western blot and statistical analysis of VDR protein in kidney tissues of each group. Data are expressed as the mean ± SD. *P<0.05 vs NC group; #P<0.05 vs T2DM group; ΔP<0.05 vs GLIB group.
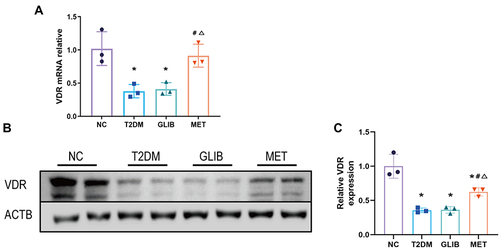
Figure 4 Metformin ameliorates VDR expression and EMT in the HK-2 cell model of high-glucose injury. (A and B) The protein expression of SMA and Ecad was detected by Western blotting HK2 cells of normal glucose group (NG), high glucose group (HG), and high glucose plus MET group (MET). (C and D) Wound healing experiment of HK2 cells of NC group, MET group, and MET+siVDR group (scale bar, 500 µm). Data are expressed as the mean ± SD. *P<0.05.
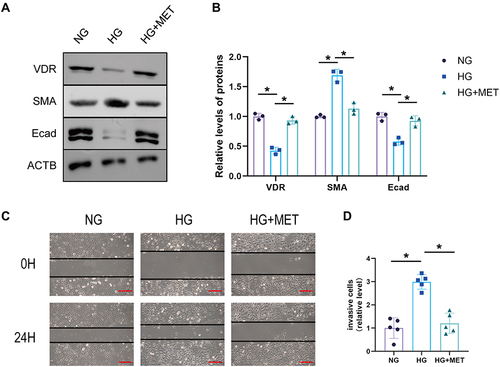
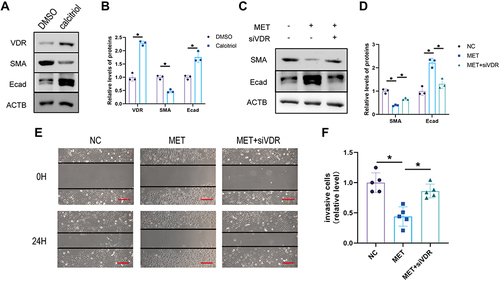
Figure 5 Metformin inhibits EMT by upregulating VDR in HK2 cells. (A) Western blot of E-cadherin and SMA expression in DMSO/calcitriol in HK2 cells and (B) statistical analyses. (C and D) The protein expression of SMA and Ecad was detected by Western blotting HK2 cells of the normal control group (NC), Metformin Intervention group (MET), and Metformin plus siVDR group (siVDR). (E and F) Wound healing experiment of HK2 cells of NC group, MET group, and MET+siVDR group (scale bar, 500 µm). Data are expressed as the mean ± SD. *P<0.05.