Figures & data
Table 1 Demographic and Clinical Characteristics of Study Participants at Baseline (N = 1438)
Table 2 Glycemic and Laboratory Data in the Entire Population at Baseline and Follow-Up
Figure 1 Heatmap representing p-values calculated through a mixed effect model. In particular, each mixed effect model was constructed by regressing one dependent variable (HbA1c, FPG, weight, SBK, DBP, TC, HDL, TG, UAER, eGFR, and LDLc) on one independent variable (age, gender, BMI, HbA1c, eGFR, duration, insulin, CVD, and HF), controlling for the country effect. Bar color: p-values ranging from <0.0001 (light gray) to 0.9999 (dark gray) and NA values are reported as white boxes.
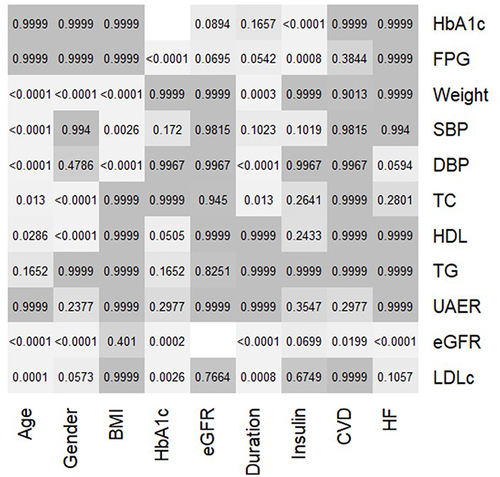
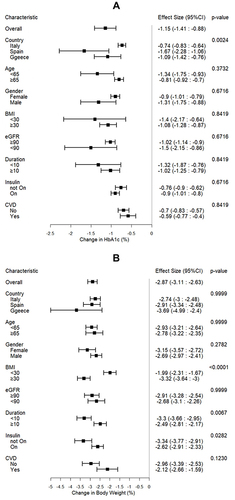
Figure 2 Forest plots showing changes in HbA1c (A) and body weight (B) in subgroups of patients by baseline characteristics.