
Figures & data
Figure 1 Hypothesis model.
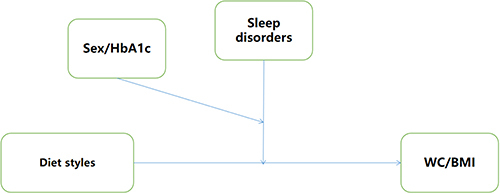
Figure 2 Flow chart of participants in study.
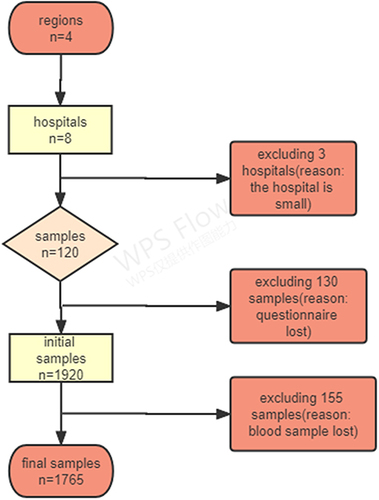
Table 1 The Characteristics of WC
Table 2 The General Demographic Characteristics of BMI and Sleep Disorders
Table 3 The Multilevel Linear Regression Between Dependent Health Risk Factors and WC and BMI
Table 4 The Moderation Analysis Between Diet (Unhealthy), Sleep Disorders, SES and BMI
Table 5 The Moderation Analysis Between Diet (Unhealthy), Sleep Disorders, SES and BMI
Table 6 The Moderation Analysis Between Diet (Healthy), Sleep Disorders, SES and BMI
Table 7 The Moderation Analysis Between Diet (Healthy), Sleep Disorders, SES and BMI
Table 8 The Moderation Analysis Between Diet, Sleep Disorders, HbA1c and WC
Table 9 The Moderation Analysis Between SSBs, Sleep Disorders, HbA1c and WC
Table 10 Model Characteristics for the Conditional Process Analysis (Diet [Unhealthy], FBG, Sleep Disorders and BMI)
Table 11 Bootstrapped Conditional Direct and Indirect Effects (Diet [Unhealthy], FBG, Sleep Disorders and BMI
Table 12 Model Characteristics for the Conditional Process Analysis (Diet [Unhealthy], FBG, Sleep Disorders and WC
Table 13 Bootstrapped Conditional Direct and Indirect Effects (Diet [Unhealthy], FBG, Sleep Disorders and WC
Table 14 Model Characteristics for the Conditional Process Analysis (Diet [Healthy], FBG, Sleep Disorders and BMI)
Table 15 Model Characteristics for the Conditional Process Analysis (Diet [Healthy], FBG, Sleep Disorders and BMI)
Table 16 Model Characteristics for the Conditional Process Analysis (Diet [Healthy], FBG, Sleep Disorders and WC
Table 17 Model Characteristics for the Conditional Process Analysis (Diet [Healthy], FBG, Sleep Disorders and WC)
Table 18 The Moderation Analysis Between Diet Styles, Sleep Disorders, FBG and WC
Table 19 The Moderation Analysis Between Diet Styles, Sleep Disorders, FBG and BMI