
Figures & data
Figure 1 Population groupings by albuminuria, eGFR and the KDIGO risk categories.
Notes: I: low risk; II: moderate risk; III: high risk and very high risk.
Abbreviations: UACR, urinary albumin/urinary creatinine ratio; eGFR, estimated glomerular filtration rate; KDIGO, Kidney Disease: Improving Global Outcomes.
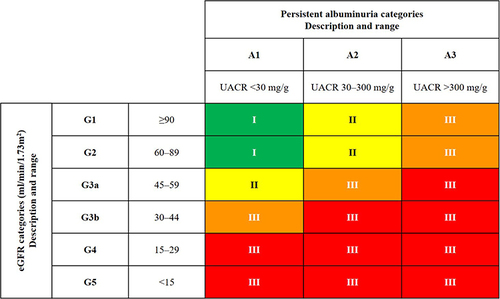
Table 1 Characteristics of Subjects
Table 2 Comparison of OPG Levels by Persistent Albuminuria Categories
Table 3 Comparison of OPG Levels by eGFR Categories
Table 4 Comparison of OPG Levels by KDIGO Categories
Table 5 Effects of Each 100 Pg/Ml Increase in OPG Levels on Albuminuria
Table 6 Effects of Each 100 Pg/mL Increase in OPG Levels on eGFR
Table 7 Effects of Each 100 Pg/mL Increase in OPG Levels on KDIGO Categories