Figures & data
Table 1 Baseline Characteristics of the Study Population
Figure 1 Metabolic characteristics of the NGT and GDM groups. (A) Glucose parameters; (B) Insulin parameters; (C) Insulin parameters adjusted by glucose; (D) Parameters of area under the curve; (E) Parameters for assessing insulin resistance and β cell function. †Variable was log-transformed before statistical analysis and is shown as median. *p<0.05; **p<0.01; ***p<0.001.
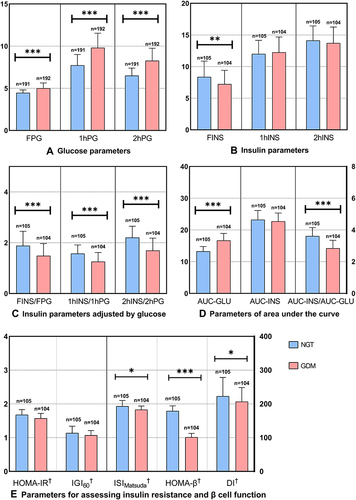
Figure 2 Prevalence of GDM subtypes in the GDM group.
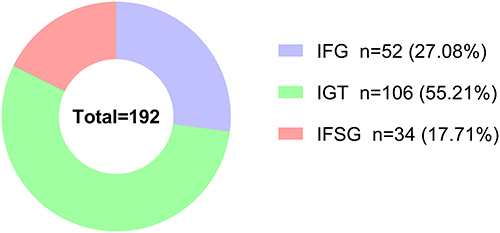
Figure 3 Metabolic characteristics of GDM subgroups. (A) Glucose parameters; (B) Insulin parameters; (C) Insulin parameters adjusted by glucose; (D) Parameters of area under the curve; (E) Parameters for assessing insulin resistance and β cell function. †Variables were log-transformed before statistical analysis and are shown as the median. *p<0.05; **p<0.01; ***p<0.001.
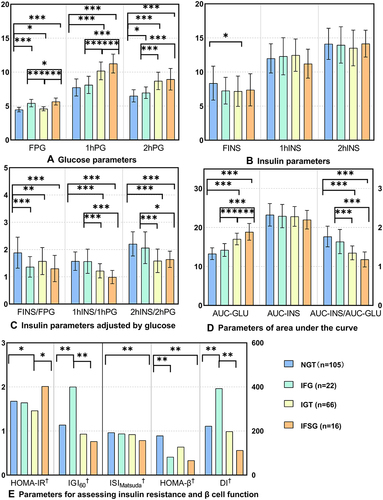
Table 2 Delivery Outcomes of Participants
Figure 4 Stepwise linear regression analyses of glucose metabolism parameters and pregnancy outcomes (A): birth weight of infants. Independent variables included in the analysis were age, height, weight, prepregnancy BMI, systolic blood pressure, diastolic blood pressure, delivery gestational age and all glucose metabolism parameters of pregnant women; (B): delivery gestational age. Independent variables included in the analysis were age, weight, height, prepregnancy BMI, systolic blood pressure, diastolic blood pressure and all glucose metabolism parameters.
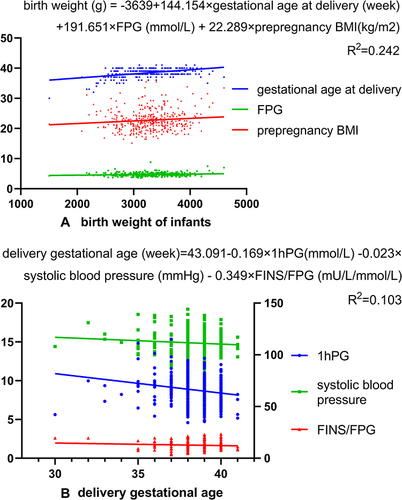
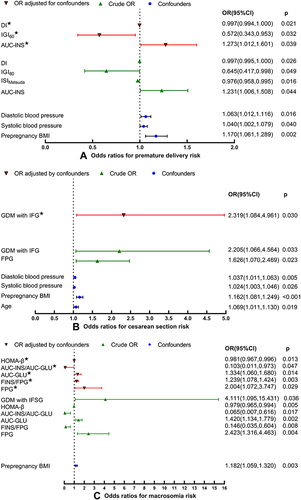
Figure 5 Risk factors for adverse perinatal outcomes in glucose metabolism parameters. (A) Odds ratios for premature delivery risk. ★OR was adjusted for prepregnancy BMI, systolic blood pressure and diastolic blood pressure; (B) Odds ratios for cesarean section risk. ★OR was adjusted for age, prepregnancy BMI, systolic blood pressure and diastolic blood pressure; (C) Odds ratios for macrosomia risk. ★OR was adjusted for prepregnancy BMI.