Figures & data
Figure 1 Flow diagram of the enrollment of study subjects.
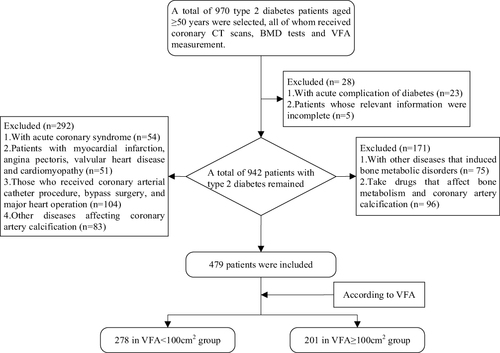
Figure 2 Identification of coronary artery calcifications (red arrows) in patients with type 2 diabetes. The coronary calcium score of left was 64 (with non-visceral obesity) while the right was 302 (with visceral obesity).
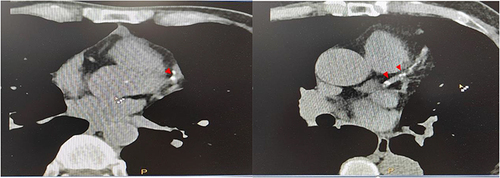
Table 1 Clinical and Biochemical Features
Figure 3 Coronary artery calcium score distribution difference between VFA<100cm2 and VFA≥100cm2.
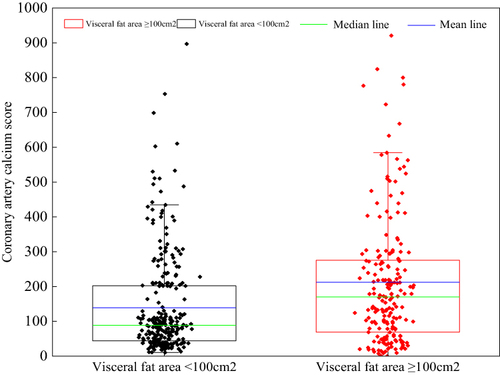
Figure 4 Bone mineral density distribution difference between VFA<100cm2 and VFA≥100cm2 in 3 locations.
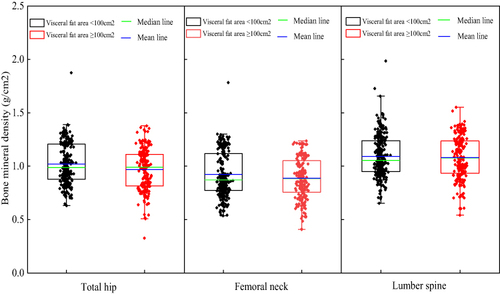
Table 2 Comparation of CACs in T2DM Patients of Normal, Osteopenia and Osteoporosis
Figure 5 Coronary artery calcium score distribution difference among normal, osteopenia and osteoporosis in visceral fat area <100cm2 and visceral fat area ≥100cm2 group.
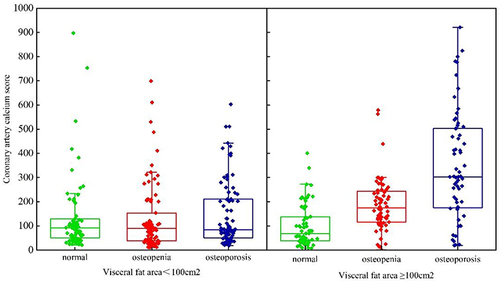
Table 3 Correlation Between CACs (Log x) and BMD by Adjusted Regression
Figure 6 Standardized regression coefficients are shown for correlation between CACs and BMD by adjusted regression analyses in all patients, visceral fat area <100cm2 and visceral fat area ≥100cm2.
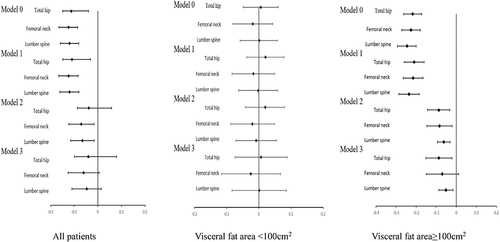
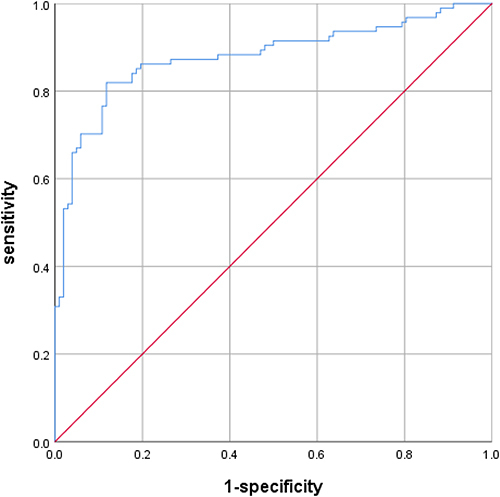
Figure 7 ROC curve analysis of CACs screening osteoporosis.