Figures & data
Figure 1 H-ADF and H-ADC ameliorates HFD-induced adiposity. (A) Overview of the design of feeding groups. (B) Dietary calories for each mouse per 48h. (C) Bodyweight (n = 5 or 10 per group). Data are presented as mean ± SE, *P < 0.05, **P < 0.01, ***P < 0.001. The differences between different feeding groups are compared using two-way ANOVA, repeated-measure, followed by Tukey. (D) Body fat ratio (n = 5 or 10 per group). ***P < 0.001, one-way ANOVA. (E) Representative images of body size and intra-abdominal fat. (F) Representative images of visceral white adipose tissue (HE-staining), scale bar = 100 μm. (G) Representative images of brown adipose tissue (HE-staining), scale bar = 100 μm.
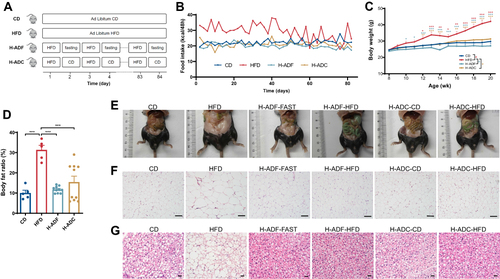
Figure 2 H-ADF and H-ADC ameliorates HFD-induced metabolic disorder. (A) Glucose curve of oGTT (n = 5 or 10 per group). Data are presented as mean ± SE, *P < 0.05, **P < 0.01, ***P < 0.001. The differences between different feeding groups are compared using two-way ANOVA, repeated-measure, followed by Tukey. (B) Area under the curve (AUC) of glucose measured by oGTT. (C) Overnight fasting plasma insulin levels (n = 5 per group). (D) Western blots (left) and statistical analysis (right) of total Akt (t-Akt) and phosphorylated Akt (p-Akt) at ser473 in the liver (n = 3 per group). (E) Plasma TC, TG, LDL, HDL levels (n = 5 per group), *vs HFD, # vs CD. (F) Representative images of liver tissues (HE- and oil red o-staining), scale bar = 100 μm. Data are presented as mean ± SE, *P < 0.05, **P < 0.01, ***P < 0.001, #P < 0.05, ##P < 0.01, ###P < 0.001, one-way ANOVA unless otherwise indicated.
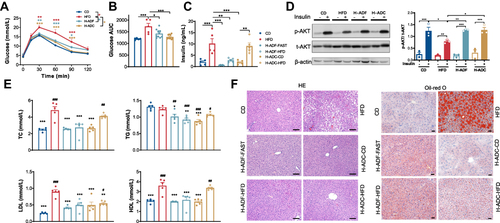
Figure 3 H-ADF and H-ADC prevent HFD-induced lipids absorption and Paneth cell dysfunction. (A) Representative images of jejunal tissues (HE-staining), scale bar = 100 μm. (B) Length of jejunal villus (n = 5). (C) Representative images of the lipid uptake in the jejunum in mice 2 hr after BODIPY-FA gavage. Green fluorescence represents lipids. Scale bar, 100 μm. (D) Representative image of Lyz1 immunohistochemistry of jejunum tissues, scale bar = 50 μm. (E) Numbers of Paneth cell per crypt (n = 3). (F) Heatmap demonstrating the expression of Lyz1, α-defensin (Defa) family members, Mmp7 and Muc2 in the jejunum. Data are presented as mean ± SE, *P < 0.05, **P < 0.01, one-way ANOVA.
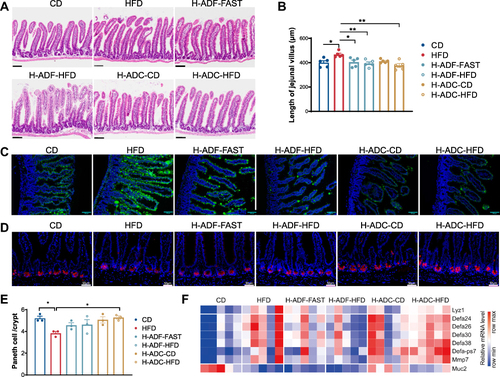
Figure 4 RNA-Seq data analysis. (A) PCA score plot of the gene expression data in the jejunum of the 20-wk old mice. (B–F) KEGG pathway enrichment analysis of changes in the transcriptome of the jejunum.
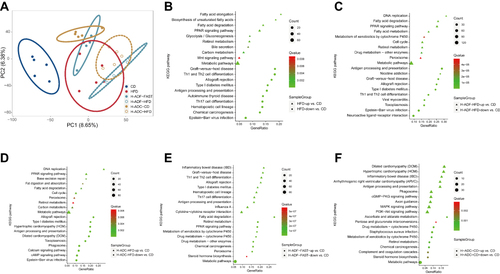
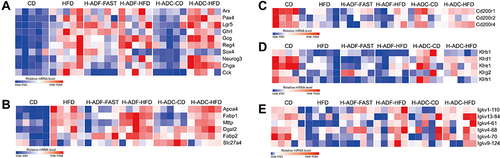
Figure 5 H-ADC suppresses cell proliferation and restores immunity in small intestine. (A) Heatmap showing the expression of cell proliferation-related genes. (B) heatmap showing the expression of absorption-related genes. (C–E) heatmap showing the expression of immunity-related genes.