
Figures & data
Table 1 Clinical Baseline Characteristics of All Included Populations
Figure 1 Flow chart of the included subjects.
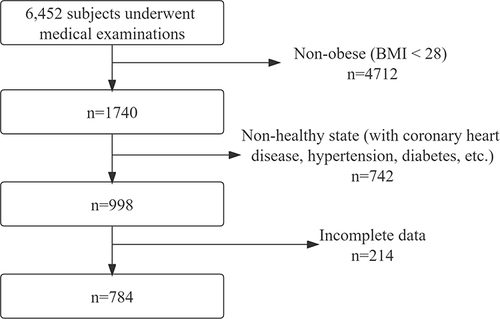
Table 2 Comparison of Indicators Between the Low-TyG and High-TyG Groups
Figure 2 Comparison of liver function parameters between the low TyG index and high TyG index groups. (A) Total Protein. (B) Albumin. (C) Direct bilirubin. (D) Alanine aminotransferase (ALT). (E) Aspartate aminotransferase (AST). (F) AST/ALT. ***P<0.001.
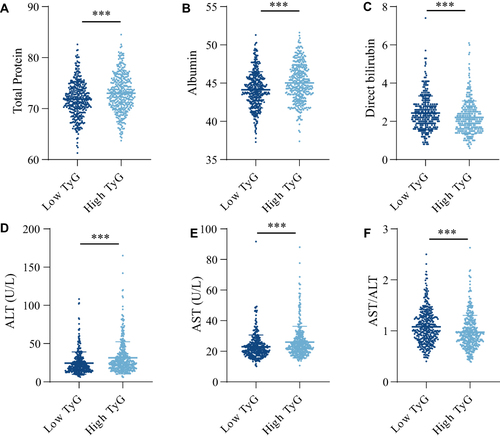
Table 3 Comparison of Indicators Between the Male and Female Groups
Table 4 Correlation Between TyG Index and Liver Function Parameters
Figure 3 Correlation between TyG index and liver function parameters. (A) Alanine aminotransferase (ALT). (B) Aspartate aminotransferase (AST). (C) AST/ALT. (D) Total Protein. (E) Albumin. (F) Direct bilirubin.
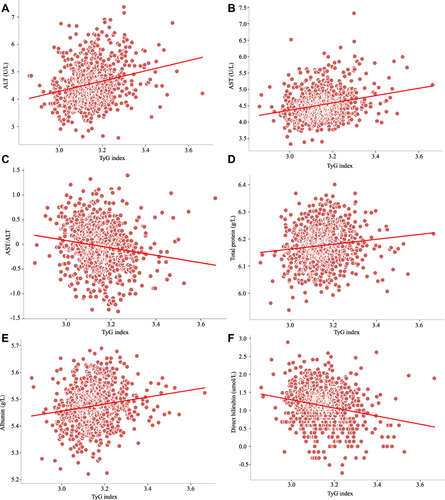
Table 5 Correlation Between TyG Index and Liver Function Parameters in Different Genders
Figure 4 Correlation between TyG index and liver function parameters in different genders. (A) Alanine aminotransferase (ALT). (B) Aspartate aminotransferase (AST). (C) AST/ALT. (D) Total bilirubin. (E) Direct bilirubin. (F) Indirect bilirubin. (G) Total Protein. (H) Albumin. (I) Albumin. A-H indicates the correlation between TyG index and liver function parameters in males, while I indicates females.
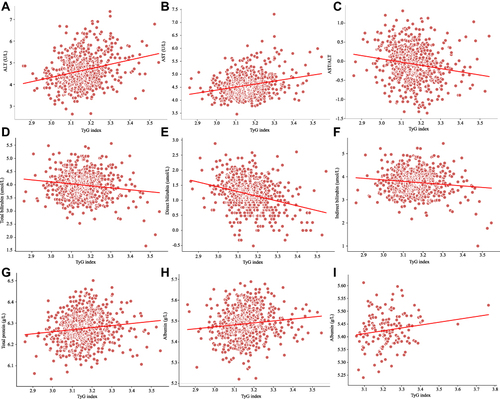
Table 6 Multivariate Linear Correlation Analysis of TyG Index and Liver Function Parameters in Obese Population