
Figures & data
Figure 1 Influence of hyperinsulinemia on various human organs.
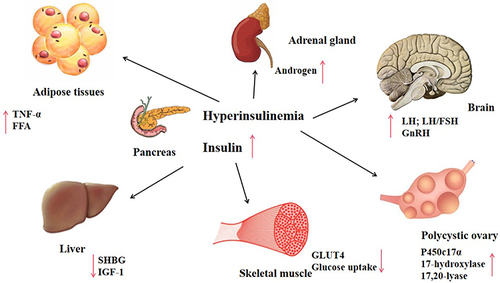
Figure 2 Summarized scheme of the pathophysiology of PCOS.
Abbreviations: GnRH, gonadotropin-releasing hormone; LH, luteinizing hormone; FSH, follicule-stimulating hormone; SHBG, sex hormone –binding globulin.
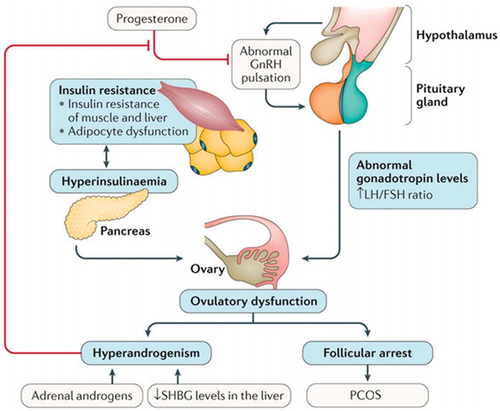
Figure 3 Genetic map of human mitochondrial genome, which has a 16,569 bp sequence. Red boxes indicated PCOS-IR–associated mtDNA mutations.
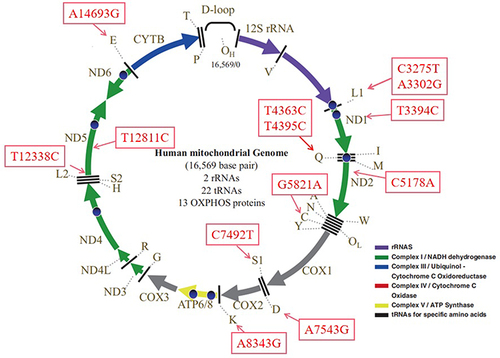
Figure 4 Heteroplasmy and the threshold effect.
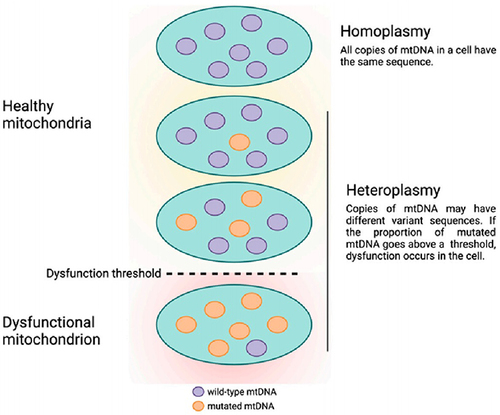
Figure 5 (A-G) Cloverleaf structure of mt-tRNA genes, arrows indicate the positions of PCOS-IR related mutations.
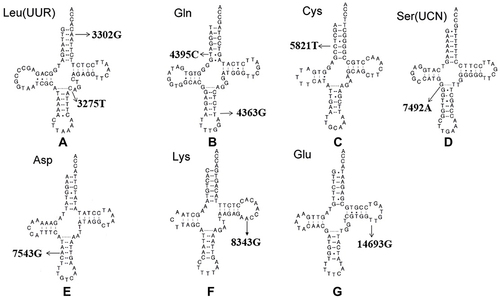
Table 1 Summary of PCOS-IR–associated Mt-tRNA mutations