
Figures & data
Table 1 Clinical Characteristics and Biochemical Parameters of Type 2 Diabetic Elderly Patients with and without MCI
Figure 1 Serum levels of Klotho in T2DM and control cases. All data are medians and inter-quartile range (IQR); P values refer to Mann–Whitney U-tests for differences between groups. ***P<0.001 vs healthy control group (without MCI) and ###P<0.001 vs healthy control group (with MCI).
Abbreviations: MCI, mild cognitive impairment; T2DM, type 2 diabetes mellitus.
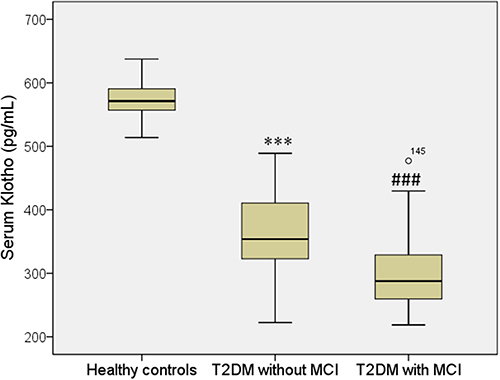
Table 2 Relationship of Serum Level of Klotho with Other Clinical Indicators in Group of Diabetic Elderly Patients
Table 3 Assessment Results of the Risk of Having MCI in a Multivariable Logistic Regression Model in Elderly Patients with Type 2 Diabetes