
Figures & data
Figure 1 Study flow chart.
Notes: (A) Flow chart of participants in the cross-sectional analysis. (B) Flow chart of participants in the prospective cohort analysis.
Abbreviations: PAD, peripheral arterial disease; MAFLD, metabolic dysfunction-associated fatty liver disease; CHD, coronary heart disease; AF, atrial fibrillation; LVH, left ventricular hypertrophy; VHD, valvular heart disease; RHD, rheumatic heart disease; HF, heart failure.
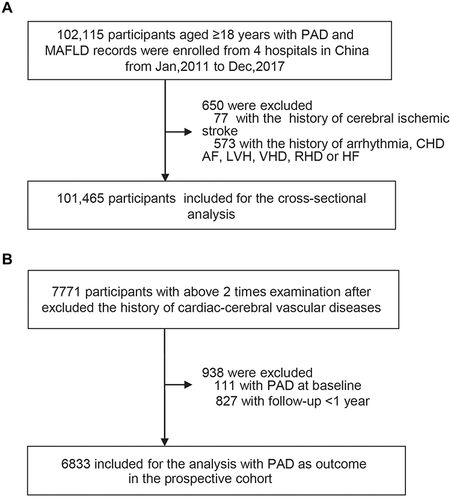
Table 1 Baseline Characteristics of Participants in the Cross-Sectional Study
Table 2 Association Between MAFLD and the Presence of PAD in the Cross-Sectional Analysis
Table 3 The Association Between Baseline MAFLD and the Incidence of PAD in the Prospective Cohort Analysis
Figure 2 Risks of the presence PAD in association with MAFLD in subgroups.
Notes: The model was adjusted for age, sex, red blood cell, leukocyte count, hemoglobin, platelet count and eGFR.
Abbreviations: BMI, body mass index; OR, odds ratio; CI, confidence interval.
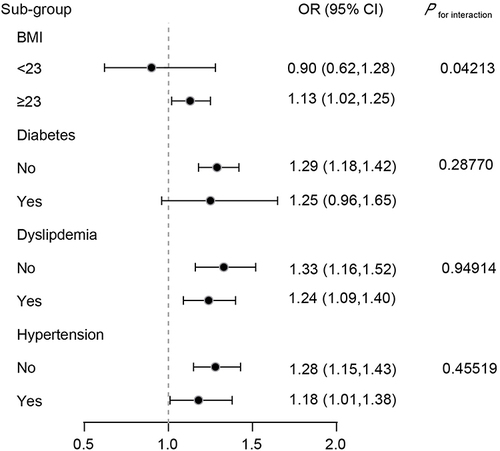
Table 4 Sensitivity Test I for PAD in Cross-Section Study After Further Adjusting FIB-4