Figures & data
Figure 1 Regional body composition measurement and regions of interest (ROI) in the android and gynoid by dual-energy X-ray absorptiometry (DXA).
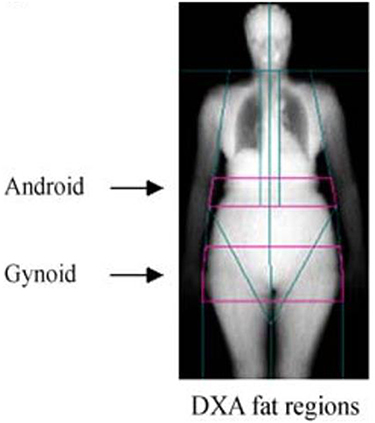
Table 1 Characteristics of the Study Population by CAP
Figure 2 Proportion of different grades of hepatic steatosis in diabetes-specific groups. S0: normal, fatty infiltration<5%; S1: mild, 5%~33%; S2: moderate, 33%~66%; S3: severe, ≥66%.
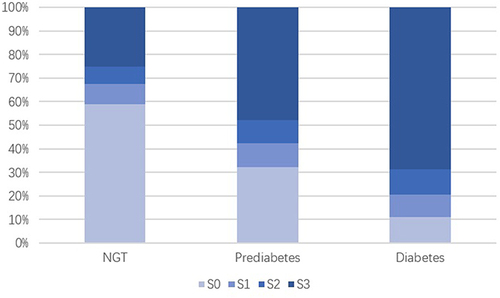
Figure 3 Association between different parameters of adipose distribution and CAP, stratified by NGT, prediabetes and diabetes, with LOWESS smooth for trend.
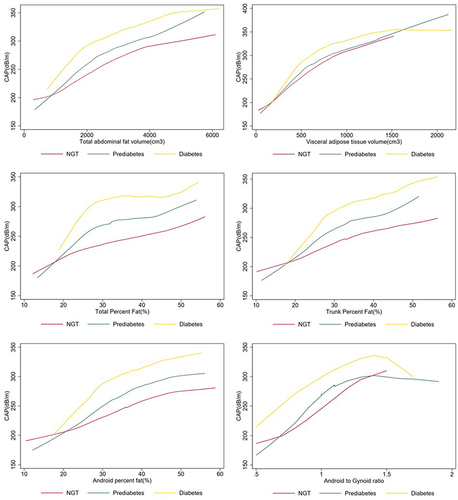
Table 2 Interaction Between Adiposity Measures and Glycemic Status on Presence of Hepatic Steatosis in the Overall Group
Table 3 Association of Prevalence of Fatty Liver Disease with Different Parameters of Adipose Distribution, Sorted by Glycemic Status
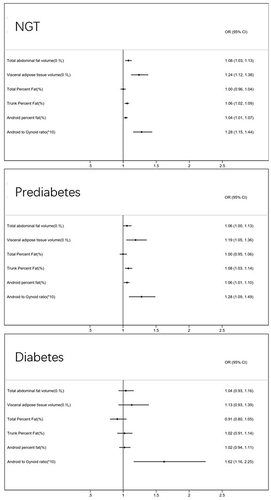
Figure 4 Forest plots of OR and 95% CI of different parameters on hepatic steatosis, stratified by NGT, prediabetes and diabetes.