Figures & data
Table 1 Clinical Characteristics of the Study Participants at Baseline
Figure 1 Comparison of clinical characteristics between mild NPDR and VTDR in the training and testing sets. Comparing with mild NPDR, 2-h C-peptide was significantly lower (A) and the median duration of diabetes was longer at the border of statistical significance (B) in the VTDR patients. As the severity of UACR and SNCI increased, the proportion of VTDR increased (C and D).
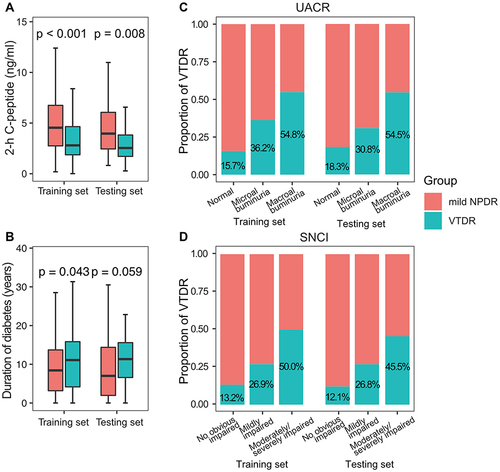
Figure 2 Forest plot and receiver operating characteristic curve for logistic regression analysis. 2-h C-peptide, SNCI, and UACR were included in the logistic regression (A). The area under the receiver operating characteristic curve of the training set (B) and the test set (C) were 0.76 and 0.73, respectively.
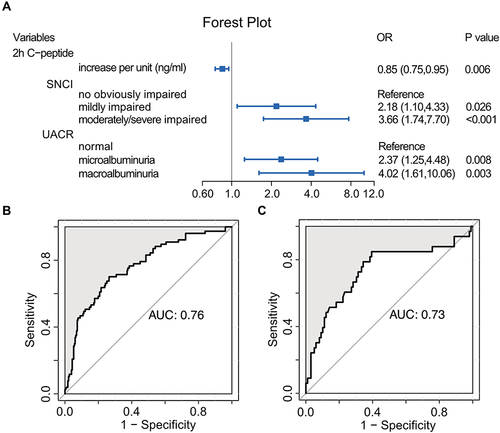
Figure 3 Nomogram to estimate the risk of VTDR (A). Each predictor is assigned a score on each axis. Compute the sum of points for all predictors and denote this value as the total points. The corresponding “risk of VTDR” of “total point” was converted to a predicted probability of VTDR. Calibration curve of the training set with 1000 bootstraps (B). The model was well calibrated when the predicted risk agreed well with the actual probabilities.
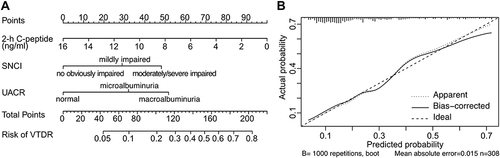
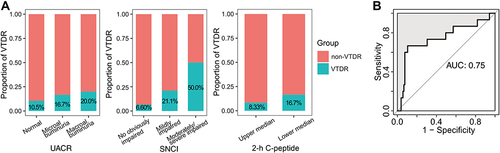
Figure 4 Proportion of VTDR and predicting AUC in the prospective cohort. As the grade of UACR and SNCI increased, the proportion of VTDR increased. Besides, more VTDR occurred in the lower-median 2-h C-peptide group than that in the upper median 2-h C-peptide group (A). AUC of prediction was excellent (B).