Figures & data
Table 1 Primer Sequences
Table 2 Basic Information on Experimental Mice
Figure 1 DOMC reduced plasma lipids by regulation of lipolysis and β-oxidation. (A) Plasma TG, TC, LDL, and HDL measurements after a 4-week experiment. (B) RT-qPCR analysis for detection of lipolysis and fatty acid β-oxidation associated gene PPARα, CPT1a, MACD, and Acox1 on epididymal adipose tissue. (C) Plasma adiponectin and gene expression of adiponectin on epididymal adipose tissue. The data were presented as means ± SD; n=6-10/group. *p<0.05, **p<0.005, ***p<0.001, ****p<0.0001.
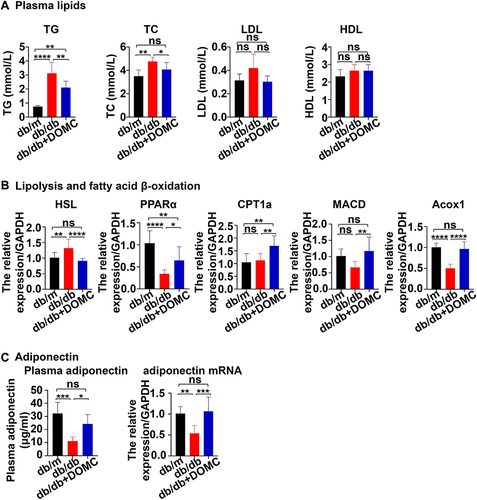
Figure 2 DOMC ameliorated fatty liver by reduction of lipogenesis and β-oxidation. (A) HE and Oil red O staining of the liver to evaluate liver steatosis. (B) a. RT-qPCR analysis of fatty acid β-oxidation in the liver. b. Western blot to test PPAPα at the protein level. (C) lipogenesis-associated genes in the liver. The data were presented as means ± SD; n=6-10/group. *p<0.05, **p<0.005, ***p<0.001, ****p<0.0001. Scale bar: 50 μm.
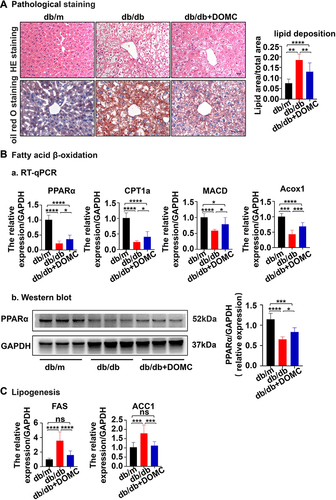
Figure 3 DOMC regulated glucose homeostasis in db/db mice. (A) The test of fasting blood glucose levels and GSP. (B) IPGTT after a 4-week experiment. (C) HE staining of the pancreas: green arrows implied the vacuolar degeneration of pancreatic islet cells. (D) Immunofluorescence co-staining of the pancreas. Each section was stained for insulin, glucagon (green) and DAPI (blue). Insulin and glucagon-positive cells were counted per visual field. The data were presented as means ± SD; n=6-10/group. *p<0.05, **p<0.005, ***p<0.001, ****p<0.0001. Scale bar: 50 μm.
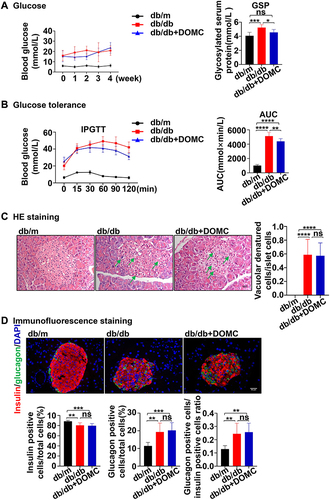
Figure 4 DOMC protected pancreatic β-cell by a long-term application. (A) The measurement of fasting blood glucose levels and AUC of IPGTT after a 12-week experiment. (B) HE staining of the pancreas. (C) Immunofluorescence of insulin and glucagon co-staining. The data were presented as means ± SD; n=8-14/group. *p<0.05, **p<0.005, ***p<0.001, ****p<0.0001. Scale bar: 50 μm.
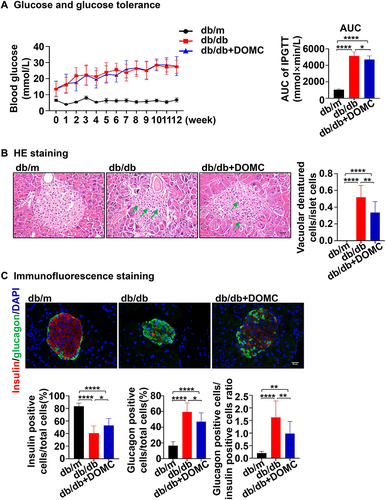
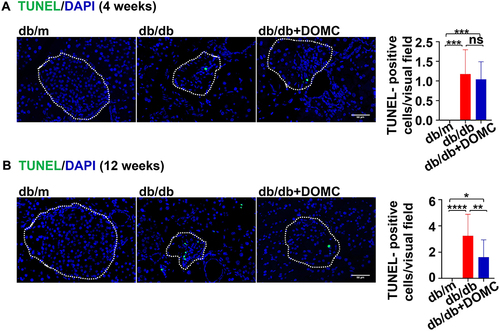
Figure 5 DOMC alleviated pancreatic β-cell apoptosis. (A) TUNEL staining of the pancreas slices after a 4-week experiment. (B) TUNEL staining of the pancreas slices after a 12-week experiment. White dotted boxes were depicted as pancreas islets, the number of TUNEL-positive cells was counted as green fluorescence cells in the boxes. The data were presented as means ± SD; n=6-14/group. *p<0.05, **p<0.005, ****p<0.0001. Scale bar: 50 μm.